-
On this page
Preliminary page
Privacy and the Community
July, 2001
Prepared for:
Office of the Federal Privacy Commissioner
8/133 Castlereagh Street
Sydney NSW 2000
Prepared by:
Roy Morgan Research
232 Sussex Street
Sydney NSW 2000
Ref: CS2436
Foreword
For a number of years now, we have seen a steady flow of privacy surveys and research coming largely out of North America, and in some cases Europe. However, we have not had similar insight into Australians and how they view their privacy.
The purpose of the Office of the Federal Privacy Commissioner (OFPC) is to promote an Australian culture that respects privacy. Our Strategic Plan 2000 identifies four key result areas in the lead up to the commencement of the Privacy Amendment (Private Sector) Act 2000. Important among these is gaining a comprehensive understanding of current community perceptions of privacy.
The outcomes of this research will help promote a balanced understanding of privacy in the community and will be a key consideration for any organisation undertaking a risk management approach to compliance. The research will also contribute significant input to the networks we are developing with, among others, business organisations, community groups and the health sector. Most immediately, the outcomes of this research will inform the Office’s communications strategy for the Privacy Amendment (Private Sector) Act which is due to commence on 21 December 2001.
This is the most comprehensive privacy research into the attitudes of individuals in Australia. From anecdotal evidence, complaints to this Office, and media coverage of the issue, we have long understood that information privacy is important to Australians. Privacy and the Community provides empirical evidence of the high value Australians place on their privacy. Overall, respondents to the OFPC research, while exhibiting a low level of knowledge and understanding in relation to privacy, show a high, and increasing level of interest in their own privacy.
Businesses, with an eye on their bottom line, will benefit from considering the concerns of consumers when undertaking their compliance programs, while not-for-profits will enhance their relationships with supporters. An understanding of the key health privacy concerns of individuals will complement existing clinical practices and foster even stronger patient relationships.
I am quite sure that time will prove good privacy practice to be simply good business.
Malcolm Crompton
Federal Privacy Commissioner July 2001
1. Executive summary
In order to gain further understanding of community attitudes towards the protection of personal information and awareness levels of current privacy laws, the Office of the Federal Privacy Commissioner commissioned Roy Morgan Research to conduct a national CATI survey (Computer Assisted Telephone Interviewing) among a representative sample of the Australian population. Interviews were conducted in May, 2001 among 1,524 of the Australian adult population (ie people aged 18 years and over).
Attitudes reflected a desire among the community to gain control over how their personal information was used with more than 9 in 10 people wanting businesses to seek permission before using their personal information for marketing. When asked if permission should still be sought if it inconvenienced consumers with extra forms etc., support remained strong with percentages in the high eighties. Similarly high proportions of people (around 9 in 10) thought it was important that organisations advise customers who may have access to their personal information and how that information might be used.
Those who tended to emerge as more pro-active in relation to the protection of the personal information were those aged 40 to 49 years, those on a higher household income and people who were aware of, and knowledgeable about, the privacy laws. Awareness of the privacy laws and knowledge about their privacy rights generally correlated with higher incidences of assertive privacy-related behaviour. (We could assume, therefore, that as awareness and knowledge grows as a result of communication campaigns, the proportion of consumers practicing assertive privacy-related behaviour is likely to increase.) Younger people were less likely to demonstrate assertive privacy-related behaviour as were those with lower levels of education and those in rural areas.
The types of personal information people felt reluctant about divulging reflected findings from earlier research with financial details, income, health information, and home contact details all commonly mentioned (in descending order) as types of information people would prefer to keep private. People aged 50+ years were more likely to be sensitive about providing financial details compared to younger people (18 to 24 years), while those on higher incomes felt more protective of this type of information than those on lower incomes.
People were reluctant to provide this type of information as they felt that often it was “none of their business” (ie none of the business of the requesting organisation). Other reasons given for not wanting to hand over particular types of personal information included the belief that the information could be misused and/or used in a way that would result in personal financial loss, or passed on without their knowledge. Fear of discrimination was also mentioned in relation to the provision of health information.
Business practices such as transferring personal information without the individual’s knowledge, and using personal information beyond the purpose for which it was originally collected, were practices that caused concern among the vast majority of the community, with large proportions registering the strongest level of concern. These findings were supported by further results which showed that over 90% of the adult population regarded each of the above practices as an invasion of privacy.
Internet retailers were perceived as the least trustworthy organisations regarding the protection and use of personal information, scoring 1.98 on a scale of 5, with real estate agencies and market research companies rating slightly above them. Health service providers were, by far, perceived to be the most trustworthy type of organisation (scoring 4.16 out of 5), followed by financial organisations, government agencies, charities and retailers. Generally younger people showed higher levels of trust towards more organisations than other age groups which perhaps indicates a possible correlation between inexperience and high levels of trust.
People, particularly younger ones and those on higher incomes, were more likely to trust an organisation that gave them control over how their personal information was used, and over half were more likely to trust an organisation that had a privacy policy. Younger people and those on higher household incomes were more likely to say they’d trust an organisation that had a privacy policy.
While the majority of the population appeared to be fairly compliant when asked to provide their personal information to organisations, a relatively sizeable proportion (2 in 5) had nevertheless refused to deal with businesses they felt did not adequately protect their privacy. This has implications for privacy-lax businesses as approximately half of those from the highest income bracket (household income of $60,000+) had decided not to deal with a business on the grounds of privacy concerns.
The importance of good privacy practices to businesses that deal with personal information was further reinforced with the finding that ’respect for, and protection of, my personal information’ was, overall, the aspect of service that mattered most to the largest proportion of consumers, with over one-third rating this service aspect above quality of product, efficiency, price and convenience. Quality of product, however, rated a close second and was rated above ‘respect for privacy’ by men and people on higher household incomes.
The relatively low importance of price compared to the protection of personal information was further demonstrated with less than one-third of people prepared to provide personal information to a business in return for discounts. Younger people were the exception, however, with the majority of 18 to 24 year-olds (59%) prepared to trade personal information for cheaper prices. This is consistent with results that show young people also had higher-than-average percentages who saw price and efficiency as more important than respect for privacy.
While less than a third of the population would provide their personal information for discounts, over 40% were willing to trade their personal details in return for more efficient and personalised service, with more than half of many sub-groups, including younger people and those with higher household incomes, prepared to do so. People less likely to trade their personal information in return for particular benefits were those from the 50+ age group, those with a household income of under $30,000, and those with lower levels of education. Hence, this and other findings support aspects of earlier privacy research which suggests that people from lower socio-economic groups register more concern about protecting their privacy.
As indicated earlier, this higher level of concern, however, does not necessarily translate in to pro-active behaviour, which is more common among high income earners and those who are aware of their privacy rights. Findings suggest therefore, that those on higher household incomes and people with an understanding of the issues are making judgements about what’s important and what’s not, and acting on these, while those with lower levels of knowledge and understanding of the issues are possibly less sure of how to actively protect their privacy (and possibly feel more concern because of this), and less able to discern which practices are more harmful or harmless than others. Hence, results reveal higher levels of concern across a broader range of issues.
Just over 2 in 5 people (43%) knew that Federal privacy laws existed and 13% knew which types of organisations the laws applied to. Awareness of the privacy laws was lowest in the 18 to 24 year age group (25%), and highest among those aged 40 to 49 years, with almost half knowing about the laws. Awareness was slightly higher among people in capital cities (46%) and lower in rural locations (35%).
When asked directly how knowledgeable they felt about their privacy rights more than half of the population (52%) said they knew very little or nothing at all. A series of statements designed to test people’s understanding of the laws confirmed the relatively low level of knowledge with two-thirds of the population scoring 50% or less out of a possible score of 100. Only 4% of the population scored 100 out of 100. Men appeared to know more about the application of the privacy laws than women, as did high income earners and people with a degree, while, overall, younger people appeared to be less knowledgable.
While over one-quarter of the population (26%) knew of the Privacy Commissioner, only 5% mentioned the Commissioner when asked who they’d report a privacy breach to. The Ombudsman was most commonly mentioned when asked who’d who they’d report a privacy breach to, followed by the organisation involved, Consumer Affairs, a lawyer, an MP, and the police - all who received more mentions than the Privacy Commissioner.
The majority of people (75%) agreed with the practice of data-matching across government agencies as a fraud-reduction measure, and also agreed to the monitoring of people’s use of health service facilities through the allocation of a unique number (81%), however, support for police access to a personal information database (on the premise that access would mean that more crimes would be solved) was significantly lower with just over half agreeing with the idea (55%). While these results may indicate lower levels of trust in the police, they may also be explained by findings in the qualitative research which suggests that most people are unaware of the deeper privacy issues surrounding the allocation of unique numbers and data matching. However, as demonstrated in the focus groups, the more they learned about the issues (through a knowledgeable group member), the more they began to heavily qualify their acceptance of the one-number concept, or to reject it altogether. Hence findings regarding the ‘unique number’ concept (and possibly data matching), may well reflect low awareness among the general population in relation to the more complex privacy issues surrounding such concepts.
The desire for people to control the use of their personal information was again made clear in the survey with the majority of people (66%) believing that inclusion in a national health information database should be voluntary rather than mandatory. Women, younger people and those with a degree were more likely to support voluntary inclusion if such a database existed.
Similarly, over half of the population (61%) thought that an individuals’ permission should be gained before their unidentified health information was used for research purposes. (This finding was surprising given that the qualitative work suggested that people generally didn’t mind unidentified health information being used for research purposes.) People with higher levels of education and on higher incomes, however, were less likely to believe that permission to use unidentified information should be sought. Nevertheless, the desire to protect their medical information was quite strong with over 40% of people believing that medical staff should not discuss a patient’s details with other medical staff without first seeking the patient’s permission, even though disclosure was intended to result in better treatment for the patient. This figure was highest among those with a degree, (47%).
Questions regarding the use of public lists for marketing purposes showed that while a clear majority (70%) were against use of the electoral role for such purposes, people were split on whether or not it was acceptable to use the White Pages Telephone Directory for marketing. Again, findings confirm that women and people from lower income groups are more likely to want to protect their personal information, with fewer people from these sub-groups supporting the use of either public list.
When dealing over the internet the majority of people (57%) had more concerns about the security of their personal information, hence approximately one-third of internet users had attempted to protect their privacy by setting their web-browser to reject cookies. Another third, however, were not aware of cookies or what they did. When asked about attitudes towards tracking users over the internet without their knowledge, over 90% of people thought this was an invasion of privacy.
Just over half of all internet users had seen or read a privacy policy displayed on an internet site and over one-quarter said seeing or reading the policy made them feel more positive about the site.
2. Introduction
2.1 Background information
The Office of the Federal Privacy Commissioner (OFPC) is an independent statutory office responsible for promoting an Australian culture that respects privacy. The office currently has responsibilities under the Federal Privacy Act 1988 for the protection of individuals’ personal information.
The responsibilities of the Office, however, will broaden substantially in December 2001 when the Privacy Amendment (Private Sector) Act commences.
The Act extends the Privacy Act 1988 to the private sector, thus requiring private sector organisations to comply with the National Privacy Principles which set standards for the handling of personal information.
In order to assist in the development of an effective communication strategy to advise the various target groups of the changes, and to inform future policy development, in January 2001 the Office of the Federal Privacy Commissioner commissioned Roy Morgan Research to undertake research into community, business and government agency attitudes towards privacy.
In order to ascertain the views of each target group (ie community, business and government) three separate surveys were conducted, each involving a qualitative and quantitative component. For the ‘community’ target group (the focus of this report) the research included a qualitative component involving 6 focus groups, as well as a quantitative survey consisting of approximately 1,500 telephone interviews.
This report details the methodology and findings from the quantitative component of the community survey.
2.2 Research objectives
Broadly, the objectives of the survey involved:
- identifying current behaviours of individuals in relation to the privacy of personal information;
- identifying community expectations in relation to privacy practices;
- gauging current levels of knowledge with regards to privacy; and
- gauging current levels of awareness and understanding of the privacy laws and the privacy commissioner.
3. Methodology
3.1 Interviewing
A total of 1,524 CATI (Computer Assisted Telephone Interviewing) interviews were conducted nation-wide in April 2001. The sample was randomly selected from the latest version of the Electronic White Pages with quotas set according to age, sex and location. Interviews were conducted from Roy Morgan Research offices in Melbourne, Sydney and Adelaide, with interviewer briefings conducted by Field Managers at each of the sites.
3.2 Questionnaire design
The questionnaire was designed in close consultation with staff from the Office who, in turn, sought input from a committee of stakeholders. Questionnaire design was aided by the findings from the qualitative phase in terms of identifying appropriate pre-codes to questions and the suitability of the proposed content. The final questionnaire consisted of 47 questions and took an average of 22 minutes for respondents to complete.
A copy of the survey questionnaire is attached at Appendix A.
3.2.1 Pilot testing of the questionnaire
After finalisation of the draft questionnaire, a pilot phase was conducted to ensure the questionnaire worked well over the phone. While the pilot phase showed that there were no problems with the flow or comprehension of the questions, interviews were exceeding the expected interview length by 7-8 minutes. Given that all questions included in the questionnaire were of importance to the Office, rather than remove questions to reduce the interview length, the decision was made to reduce the initial sample size (from 2000 to 1500) in order to keep within the research budget.
3.3 Sample design
To ensure the sample adequately represented a true cross-section of the Australian population it was stratified by location (capital cities, other metropolitan and rural) and allocated across all states. To increase the precision of estimates for these locations capital city locations were slightly under-sampled while other metropolitan and rural locations were over-sampled.
Age quotas (loose) for each location were set to ensure proportional representation at the national level. Quotas were also set for each state, with smaller states over-sampled and larger states under-sampled.
The number of interviews conducted for each age group within the three locations can be seen in the following table.
| 18-24 years | 25-39 years | 40-49 years | 50+ years | TOTAL | |
|---|---|---|---|---|---|
| Capital cities | 106 | 227 | 159 | 266 | 758 |
| Regional/Other metro | 58 | 107 | 104 | 184 | 453 |
| Rural | 34 | 87 | 65 | 127 | 313 |
| TOTAL | 198 | 421 | 328 | 577 | 1,524 |
The spread of sample across states is shown below.
| NSW/ACT | Vic. | Qld. | WA | SA | NT | Tas. | TOTAL |
|---|---|---|---|---|---|---|---|
| 386 | 297 | 302 | 172 | 157 | 94 | 116 | 1524 |
Forty-six percent (693) of interviews were conducted with men and fifty-four percent (831) with women.
The spread of respondents (18 years and over) across the 3 different household income groups is shown in the table below. While quotas were not set on the basis of this variable, a random sampling methodology should have ensured a representative sample across income. While sample figures for the two income groups closely reflect the percentages in the wider population, the lowest income group is somewhat under-represented, as is the ‘can’t say/refused’ category - probably due to the subject matter of the questionnaire (ie a heightened sensitivity to giving out personal information).
| Household Income | % of Sample | % of Wider Population[1] |
|---|---|---|
| Household income of less than $30,000 | 15% | 24% |
| Household income of $30,000 to $59,000 | 20% | 22% |
| Household income of $60,000 + | 28% | 27% |
| Can’t say/ Refused | 37% | 27% |
3.3.1 Classifying locations
The Rural, Remote and Metropolitan Areas Classification System, developed jointly by the (former) Department of Human Services and Health, and the Department of Primary Industries and Energy, was used to stratify the sample by location. The classification system has been used by the Commonwealth, State and other agencies in a variety of policy or program areas. A summary of the classification units is provided below.
Metropolitan areas
- Capital city (Statistical Divisions)
- Other metropolitan centre -uc population of 100,000 or more (1 or more SSDs)
Non-metropolitan zones
Rural Zone
- Large rural centre: urban centre population of 25,000 - 99,000
- Small rural centre: urban centre population of 10,000 – 24,999
- Other rural area: urban centre population of < 10,000
Remote Zone
- Remote centre: urban centre population of 5,000 or more
- Other remote area: urban centre population of < 5,000
The three locations used for this survey were Capital City, Other Metro and Rural (this includes all rural and remote zones).
3.4 Auditing and quality control
A total of 186 interviews (12%) were audited by CATI supervisors as part of Roy Morgan Research’s quality control procedures. While two-way ‘live’ auditing (using a CATI system that allows the supervisor to listen in and watch the interview process as it is happening) was undertaken in Sydney and Melbourne offices, one-way audits were conducted by the Field Manager in the Adelaide Office. (One-way auditing is similar to two-way auditing however the respondent cannot be heard.)
No difficulties or problems with interviewers or the interviewing process were revealed through the auditing process.
3.5 Response Rates
The following table shows the number of calls made to achieve the 1,524 interviews, along with the number of refusals and terminations.
| Response | Number |
|---|---|
| Interviews achieved | 1,524 |
| Refusals | 4,925 |
| Terminated mid-interview (respondent drop out) or terminated due to hearing/language difficulty/very elderly/incomprehensible | 1,020 |
| Quota fail (ie no-one in household meets criteria. This would occur towards the end of the survey when many of the age quotas had already been filled) | 1,027 |
| Number called 4 times and no answer or engaged on each occasion | 808 |
| Unobtainable (number invalid or no longer in use) | 3,665 |
Of all people contacted, approximately 1 in 5 completed the interview, hence a response rate of 20%. Given the length of interview, this response rate is acceptable and similar to response rates of other comparable surveys.
3.6 Weighting of data
The data collected in the survey were weighted according to age, location (including state) and gender characteristics of the wider Australian population with estimates derived from the latest ABS figures.
Unless specifically stated, percentages quoted throughout the report are weighted and refer to estimates relating to the Australian population aged 18 years or over. It should also be noted that percentages have been rounded to the nearest full number and may, in some instances, slightly exceed 100 percent.
3.7 This report
The following report provides a descriptive analysis of results to each of the survey questions. Results are analysed across a number of relevant variables including age, location, state, education level and income level.
In general, the sampling variance for the sample at the national level is 1.5 to 2.5%. Hence if the survey was repeated there is a 95% probability that the same results (within a +/- 2.5% range) would be obtained.
4. Main findings
4.1 Current behaviour when filling out forms
When people were asked how they usually completed forms and applications that required personal information, almost half (47%) indicated that they sometimes, often or always left blank spaces where personal details were requested. While just over a quarter (26%) said they sometimes left blank spaces, 14% said they often did and 7% always did. In comparison, just over half (52%) of people said they never left blank spaces when completing forms that required personal information.
If those who often or always left blank spaces were regarded as being pro-active in relation to protecting their privacy, then results show that approximately 1 in 5 people could be said to behave in a pro-active or assertive manner in order to protect their privacy.
When examining the different age groups it becomes apparent that those aged 40-49 years were the most likely to regularly leave details blank than any other age group (25%), compared to only 13% of 18-24 year olds, 22% of 26-39 year olds and 20% of those aged 50 years or over. Of the youngest age group (18-24 year olds) over half said they rarely or never left blank spaces (56%), whilst of those aged between 26-39 and those over 50, 52% said they rarely or never left blanks. Differences in results across age groups can be seen in the following table.
Table 1: How often do you leave personal detail questions blank, by age
| Response | 18-24 % (195) | 26-39 % (432) | 40-49 % (336) | 50+ % (561) |
|---|---|---|---|---|
| Always | 6 | 4 | 10 | 7 |
| Often | 7 | 18 | 15 | 13 |
| Sometimes | 29 | 26 | 27 | 25 |
| Rarely | 26 | 26 | 19 | 21 |
| Never | 30 | 26 | 28 | 31 |
Base: All Respondents
People who live in rural areas were more likely to rarely or never leave personal detail questions blank (63%). This compares to 46% of those who live in capital cities and 52% who live in regional Australia. Only 12% of those in rural areas said they always or often left questions blank compared to 24% in capital cities and 21% in regional areas.
Of the 7% who said they always leave blanks 63% would not state their household income (either because they did not know or refused), in comparison, of those who said they never leave blanks, 29% did not state (or couldn’t state) their household income. When looking at income (as shown in the table below) those with higher incomes where less likely routinely complete all the personal details on forms (21%) compared to 10% of those earning under $30,000.
Table 2: How often do you leave personal detail questions blank, by household income
Response | Under $30,000 % | $30,000–$59,999 % | $60,000 or more % | Can’t say/refused % |
|---|---|---|---|---|
| Always | 2 | 3 | 6 | 11 |
| Often | 8 | 14 | 15 | 14 |
| Sometimes | 21 | 24 | 27 | 29 |
| Rarely | 24 | 23 | 26 | 20 |
| Never | 43 | 36 | 25 | 29 |
Base: All Respondents
People with a Year 10 or below education were more likely to never or rarely skip a personal detail question on a form (60%). In contrast, those with higher educational qualifications were more likely to always or often leave blanks when completing personal details (24% of those with a degree).
Interestingly, people who were aware of the existence of privacy laws were more likely than others to be pro-active in relation to protecting their privacy with 24% saying they always or often left out personal details requested on forms, compared to 18% of those who weren’t aware of privacy laws.
4.2 Decided not to deal with a business because of privacy concerns
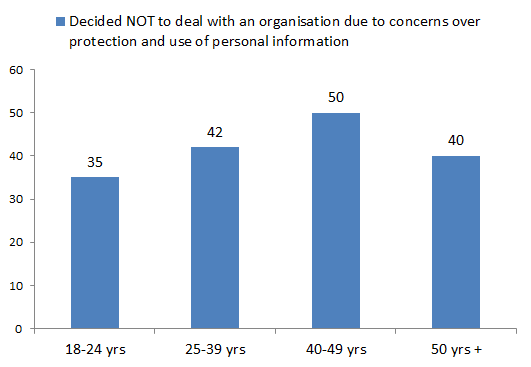
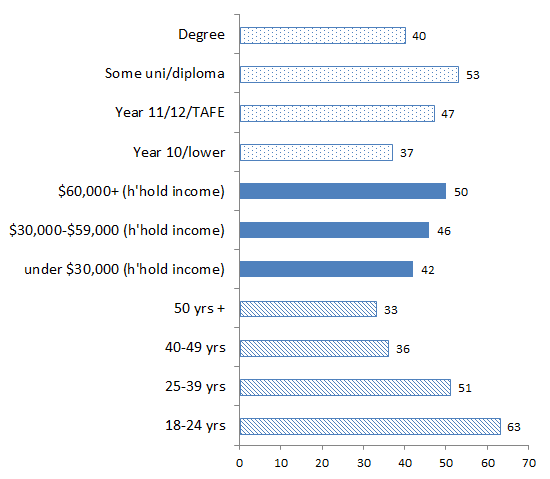
Approximately 2 in 5 respondents (42%) said they had refused to deal with an organisation because of concerns over the use and protection of their personal information. These people were more likely to belong to the 40-49 years age group - with 50% of this age group refusing to deal with a business due to privacy concerns - and to be living in a capital city, (47% in capital cities cf[2]. 40% in regional areas and 32% in rural locations).
As the following figure shows, younger people were the least likely to refuse to deal with a company because of concerns over the use and protection of their personal information.
Figure 1: The Percentage of Respondents who had decided NOT to deal with an organisation because of concerns over the use and protection of their personal information, by age
People with lower levels of education and on lower incomes were also less likely than others to have refused to deal with an organisation on the basis of concerns over the use of their personal information. For example, 35% of those with year 10 or below education had decided not to deal with an organisation due to privacy concerns compared to 48% of people who had a degree. Similarly, 28% of those on an income of under $30,000 had decided not to deal with an organisation because of privacy concerns compared to 48% of those earning $60,000 or more.
When comparing results across the states, Western Australia and South Australia had the highest percentages of people who had decided not to deal with a business (48%) while the Northern Territory and NSW had the lowest (31% and 38% respectively).
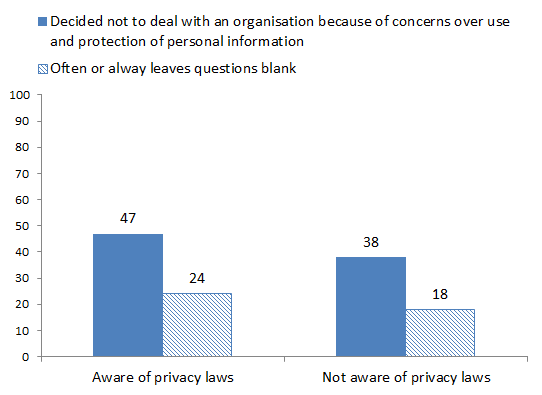
Once again, people who were aware of the privacy laws were more likely to behave in a manner that protected their privacy with 47% of this group saying they had refused to deal with an organisation because of concerns over the use and protection of their personal information compared to 38% who weren’t aware of that privacy laws existed. This clearly has implications for businesses who handle personal information as media promotion of the new legislation is likely to increase consumer awareness and understanding of the laws.
The difference in behaviour between those who were aware of the privacy laws and those who were not can be seen in the following figure.
Figure 2: Behaviour of people aware of privacy laws compared to people who are not aware of privacy laws
4.3 Decided not to deal with a government organisation because of privacy concerns
A total of 14% of people had decided not to deal with a government organisation because of concerns about the use and protection of their personal information. This lower figure (compared to 42% who had refused to deal with businesses due to privacy concerns) is probably partly due to the fact that often there’s little choice when it comes to dealing with government agencies.
Differences among sub-groups show that people aged 40-49 years were slightly more likely than other age groups to have decided not to deal with a government organisation because of concerns over the use and protection of their personal information (18% cf. 14% national average), while people in rural locations were less likely than their counterparts to exercise that option (9% cf. to 16% each of the other locations).
When comparing states, the Northern Territory had the highest percentage of people who had decided not to deal with a government organisation because of privacy concerns (20%) and Tasmania had the lowest (11%).
4.4 What information are people sensitive about?
When people were asked about the type of personal information they were reluctant to provide to organisations:
- 59% said financial details, such as bank accounts etc;
- 42% said details about their income;
- 25% said medical history or other health information;
- 17% said phone number;
- 14% said home address;
- 13% said genetic information;
- 11% said email address;
- 9% said marital status;
- 7% said date of birth;
- 6% said name;
- 2% said religion;
- 1% said details on family members; and
- 16% said none.
While responses to this question were fairly similar across most variables, some differences to emerge included the following:
people from older age groups (62% of those aged 50+ years) were more likely than people aged 18 to 24 years (47%) to feel reluctant about handing over financial details;
fewer people in rural areas and people on lower incomes mentioned financial details (including bank accounts etc) as information they were reluctant to hand over, while those with a household income of under $30,000 were less likely than their counterparts to record income as sensitive information (31% cf. 42% average);
those with a higher level of education tended to nominate a greater number of personal details that they felt reluctant about divulging when compared to those with lower levels of education. For example, people who held a degree were more likely than others to feel reluctant about divulging financial and income details as well as contact details (such as home address, phone number and email address) and medical information;
As might be expected, women were more reluctant than men to provide information relating to their marital status. Reluctance to hand over this type of information was felt by just over 1 in 10 women (11%) and 6% of men; and
Women also had higher percentages than men mentioning home address (20% cf. 15% of men) and telephone number (16% cf. 12% of men) as the type of information they were reluctant to provide.
4.4.1 What information are people most sensitive about?
When asked to nominate the one piece of personal information they felt most reluctant to hand over, financial details topped the list (40%), followed by income (11%), medical or health information (7%), home address (4%), phone number (3%) and genetic information (3%).
As seen in the table below, when asked the main reason for not wanting to provide particular types of personal information the most common response was “it’s none of their business/ it’s an invasion of privacy”, followed by fears that the information provided may be misused.
| Type of information reluctant to provide | Main reason for not wanting to provide this information |
|---|---|
| Financial details |
|
| Income |
|
| Health information |
|
| Home address |
|
4.5 What organisations do people find most trustworthy?
When people were asked about the trustworthiness of various organisations in relation to the use and protection of their personal information, health service providers, including doctors and hospitals, rated highest (scoring 4.2 out of 5), followed by banks and government organisations (each scoring 3.4 out of 5).
Internet retailers (scoring 2) and real estate agents (2.4) were the type of organisations people tended to trust the least when it came to the protection and use of personal information.
The following table shows how trustworthy various types of organisations were perceived as being in terms of the protection and use of customers’ personal information.
Table 3: The percentage of people who rated various organisations as trustworthy or untrustworthy
| Type of organisation | MEAN SCORE (out of 5) | Highly trustworthy (%) | Somewhat trustworthy (%) | Not very trustworthy (%) | Highly untrustworthy (%) |
|---|---|---|---|---|---|
| Health service providers incl. doctors and hospitals | 4.16 | 40 | 44 | 6 | 2 |
| Financial orgs. | 3.41 | 16 | 43 | 17 | 10 |
| Government | 3.40 | 15 | 43 | 17 | 9 |
| Charities | 3.35 | 10 | 44 | 18 | 7 |
| Retail | 2.81 | 3 | 32 | 31 | 13 |
| Market research organisations | 2.77 | 5 | 28 | 26 | 16 |
| Real estate agents | 2.40 | 3 | 17 | 34 | 21 |
| Internet retailers | 1.98 | 1 | 8 | 31 | 29 |
Significant differences among sub-groups in the perceived trustworthiness of organisations were as follows:
Health service providers
People in rural locations were more likely than people in other locations to perceive health service providers as highly trustworthy (48% cf. 37% in capital cities and 38% in regional areas) while those with a degree were twice as likely as others to rate them as untrustworthy. This figure remained low, however, at only 4%.
Differences across states revealed that NSW respondents were less likely than people in other states to rate health service providers as highly trustworthy (32% cf. 40% national average) however, they were still regarded as somewhat trustworthy by more than half of the population (52%).
Financial organisations
Younger people (18-24 years) were more likely than other age groups to think banks were highly trustworthy (20% cf. 16% average), as were people on lower incomes (21% cf. 16% average);
Women were more likely than men to rates banks as highly trustworthy (19% cf. 14% of men);
Queenslanders were more likely than other states to rate banks as highly untrustworthy (14% cf. 10%);
Government agencies
Again younger people were more likely than any other age group to believe that government agencies were highly trustworthy (21% cf. 15% average) while older age groups (40 to 49 years and 50+ years) were more likely than others to rate government organisations as untrustworthy (29% of 40-49 years thought they were either not very trustworthy or highly untrustworthy, as did 31% of people aged 50+ years).
People on lower household income (under $30,000) were also slightly more likely than those from other income groups to perceive government agencies as highly trustworthy (20% cf. 15% national average).
Retailers
People in rural locations were more likely than those in capital cities or regional locations to trust retailers with their personal information with 44% rating these type of organisations as either highly or somewhat trustworthy compared to 32% of people in capital cities and 34% of those in regional areas.
Men and people in capital cities were more likely than their counterparts to rate retailers as highly untrustworthy (16% of men cf. 11% of women, and 15% of those in capital cities cf. 9% in other locations.)
Real estate agents
Women were more likely than men to rate real estate agents as somewhat trustworthy (21% cf. 13%), while people with a degree were more likely to rate them as untrustworthy (60%);
People living in Queensland and Northern Territory were more likely to rate real estate agents as untrustworthy (24% and 28% respectively cf. 21% average);
Those with a household income of $30,000 to $59,000 were more likely than those in other income sub-groups to rate real estate agents as trustworthy (23% cf. 20% average), while those in the $60,000+ income bracket were more likely to rate them as untrustworthy with 61% giving this rating;
Charities
18-24 year-olds were more likely to rate charities as highly trustworthy (15% cf. 10% average), while people aged 40-49 years and 50+ were less likely to do so (7% and 9% respectively), as were those with a degree (9%);
Internet retailers
While more younger people rated internet retailers as either highly or somewhat trustworthy (approximately 14% cf. 9% average) the 18-24 year age group also had the highest percentage of people who rated internet retailers as untrustworthy (69% cf. 60% average).
Interestingly, Tasmania had the highest proportion of people who rated e-tailers as trustworthy (16% cf. 9% national average) and conversely, the lowest proportion who rated these types of organisations as untrustworthy (52% cf. 60% national average).
- People with a year 10 or lower education were less likely than others to rate e-tailers as untrustworthy (although more than half still saw them as untrustworthy, 51% cf. 60% average and 66% of those with a degree.)
4.6 Responses to unsolicited marketing information
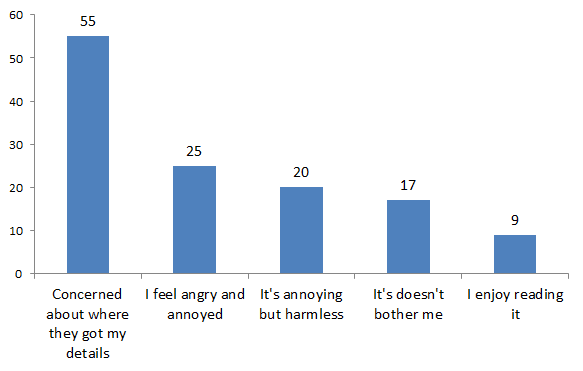
More than half of the population (55%) were concerned about how organisations (whom they had never dealt with before) obtained their name and address to send them unsolicited marketing information. Approximately 25% said they felt angry and annoyed when they received unsolicited marketing information, while 20% thought it was “annoying but harmless”. Approximately 17% weren’t bothered by direct marketing information and just under 1 in 10 (9%) said they enjoyed reading it.
These responses to unsolicited marketing information are shown in the following figure.
Figure 3: Responses to receiving unsolicited marketing information from organisations they have never dealt with before
Differences across income groups show the following:
those on lower household incomes ($30,000 or lower) were less likely than those on higher household incomes to feel concerned about where the organisation obtained their details from (47% cf. 55% national average) and slightly more likely to say they enjoyed reading the material (12% cf. 9% national average).
The 40-49 years age group had higher percentages than other age groups who were concerned about where the organisation obtained their personal details from (64%) while those from the younger age group were less likely to be concerned about this (51% of those aged 18-24 years).
People in the 40-49 years age group were also less likely to say that unsolicited marketing information didn’t bother them (10% cf. 17% average) while people aged 50+ years were more likely to tolerate it with 22% saying it didn’t bother them.
Younger people were more likely than those in other age groups to think unsolicited direct marketing was annoying but harmless, and were slightly more likely to say they enjoyed reading it (13% cf. 9% national average).
People in South Australia and Western Australia were more likely to say they enjoyed reading unsolicited marketing information (15% cf. 9% average), however Western Australians also had the highest proportion saying they felt angry and annoyed by direct marketing from a company they have never dealt with before (30% cf. 25% national average).
4.7 Should businesses have to ask for your permission before using personal information for direct marketing purposes?
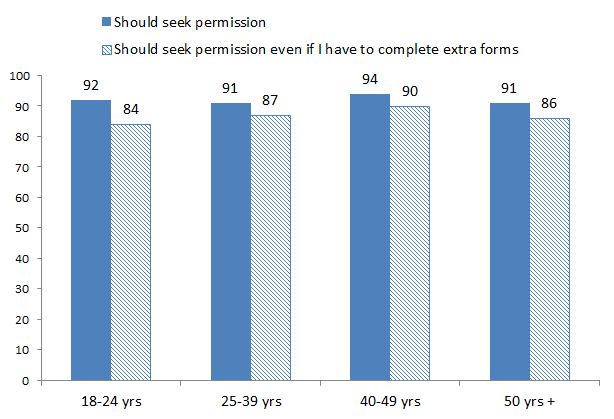
Approximately 9 in 10 people (91%) thought that businesses should have to ask permission before using people’s personal information for marketing purposes. Responses were similarly high across all variables, however there were minor differences in states with Tasmania and NSW having slightly higher percentages who thought business shouldn’t have to seek permission for marketing purposes (12% and 11% respectively cf. 7% national average).
When asked if they would still prefer businesses to seek their permission before marketing to them if this involved having to complete permission forms, the vast majority (87%) said yes. Hence, having control over the use of their own personal information was highly desirable despite the inconvenience of dealing with extra forms.
While results were consistent across most variables, differences emerged in age groups with younger people (aged 18 to 24 years) more likely to forego the need for permission if it meant completing extra forms (11% cf. 9% national average). These results can be seen in the following figure.
Figure 4: The percentage of people who think businesses should seek permission before using personal information for marketing purposes
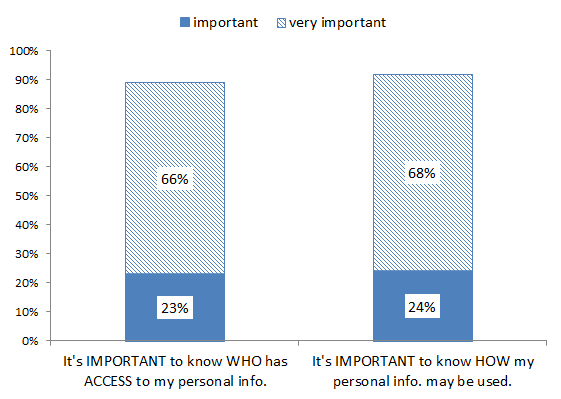
4.8 How important is it that you are advised about who may access your personal information?
Approximately 89% of the population thought it was important that organisations advise them who would have access to their personal information, with two-thirds (66%) rating this as very important. As few as 1 in 20 (5%) thought such advice wasn’t an important issue.
Attitudes on this issue were consistently high across all variables, however 40 to 49 year olds were more likely than others to say it was very important (70% cf. 66% national average) while those aged 18 to 24 years the least likely to give this rating (57%).
Slight differences also emerged on the basis of sex with women more likely than men to rate this type of information as very important (70% cf. 62% of men).
When looking at education, those with lower levels of education had few people rating it as important, however figures remained high with 83% of those with year 10 or lower education level rating advice about who has access to your personal information as important.
4.9 How important is it that you are advised about how your personal information is used?
As well as wanting to know who may have access to their personal information, the desire to know how their personal information might be used was also strong with more than 9 in 10 (92%) rating this type of information as important. Again, this information was seen to be very important for over two-thirds (68%) of the population.
Although this information was seen as important for 90% of people aged 50+ years of age, this figure was slightly lower-than-average.
As in the previous question more women than men rated this type of information as very important (72% of women cf. 64% of men).
Those on lower incomes were slightly less likely to rate this information as important (although the figure remained high at 89%), as were those who had lower education levels (86% of those with year 10 or lower education cf. to 96% of those with a degree). As in the previous question no real differences emerged across states or location.
The following figure shows how important people think it is to know who has access to their personal information and how their information could be used.
Figure 5: The percentage of people who think it’s important to know who has access to their personal information and how their information may be used.
4.10 What would make people more likely to trust an organisation with their personal information?
Respondents were given a list of ways in which an organisation might attempt to build trust with their customers and asked to nominate which of these would impact upon their level of trust towards an organisation.
As shown in the following figure, over half of the population (59%) said they’d be more likely to trust an organisation if it gave them more control over how their personal information was used, while 55% said “having a privacy policy” would help build trust.
Almost half (47%) said trust would be based on past experience with the organisation and the organisation’s reputation (46%) while 40% thought “staff showing respect for my privacy” would help build trust.
As can be seen in the following figure, younger people were more likely than older ones to nominate control and having a privacy policy as ways in which a company could build trust.
Figure 6: Ways which would help people to trust an organisation with their personal information, by age
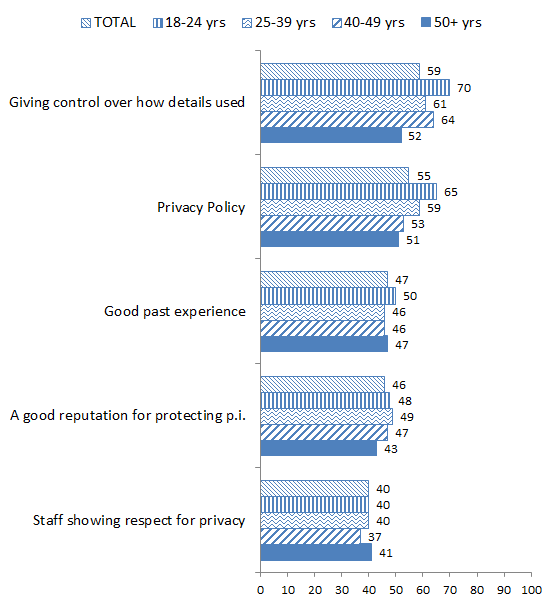
It should be noted that respondents could give multiple responses to this question
Capital city dwellers were more likely than those in regional or rural locations to nominate “having a privacy policy” as a way to build trust (59% cf. 53% of those in regional locations and 48% of those in rural locations), and also had higher percentages nominating “control over how their personal information is used” (61% cf. 53% and 48% among regional and rural locations respectively).
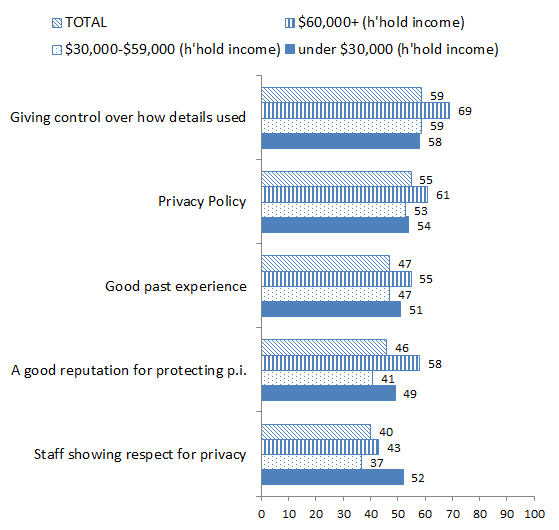
When looking at results across income groups, those earning higher incomes were more likely than those from other income groups to think more control, having a privacy policy and a good reputation would help them trust an organisation with their personal information. These results can be seen in the following figure.
Figure 7: Ways which would help people to trust an organisation with their personal information, by income
Compared to those with lower levels of education, people with a degree had higher percentages nominating each of the options as appropriate ways to build trust. For example 73% of those with a degree nominated “control” (compared to 50% of those with year 10 or lower education) and 63% nominated “having a privacy policy” compared to 49% of those with year 10 or lower education).
In terms of states, “having a privacy” was nominated among a higher percentage of those in the Northern Territory (69% cf. 55% national average) and by the fewest in Queensland (51%).
4.11 How does the protection of privacy rate among other aspects of customer service?
Respondents were asked to rate the following five service aspects according to importance:
- Respect for, and protection of, my personal information;
- Quality of product or service;
- Efficiency of service;
- Price; and
- Convenience.
For the majority of people respect for personal information and quality of product were seen as the most important service aspects. Respect for personal information, however, was rated first by the largest portion of people, (36% compared to 34% who rated quality of product/service as the most important service aspect). Eleven percent thought efficiency of service was the most important while only 8% said price and 6% convenience.
Differences in demographics with regard to the importance of service aspects were as follows:
Those from the 40 to 49 years age group were more likely than others to rate respect for and protection of personal information as the most important service aspect (44% cf. 36 average);
Men were more to think quality of product/service was of the highest importance (40% rated this aspect first compared to 33% who rated respect for and protection of personal information as first);
Quality of product also rated first among those on incomes of $60,000 or more with 39% rating this as first compared to 35% who rated respect for and protection of personal information as first);
Similarly, people with a degree, diploma or those who had completed year 11 or 12 were more likely to rate quality of product above respect for and protection of personal information while larger proportions of those with year 10 eduction or below rated respect as the most important service aspect (47% rated respect as the most important service aspect compared to 36% average);
While respect for personal information ranked first in most states, more people in the Northern Territory and Victoria thought quality of product was the most important service aspect.
While efficiency and price were seen as the most important service aspect by 11% and 8% respectively, larger proportions of the 18 to 24 year-old age group thought these aspects were of primary importance (18% rated efficiency first and 12% rated price as first).
4.12 Likely to provide personal information in return for discounts
The relatively low importance of price in comparison to the importance of having their personal information adequately protected (as shown in the previous question) is further reinforced with less than one-third (32%) saying they’d be likely to provide their personal information in return for discounted goods or services. Almost half (49%) were unwilling to trade personal information for discounts, 12% were undecided and 8% said it depended on the organisation involved.
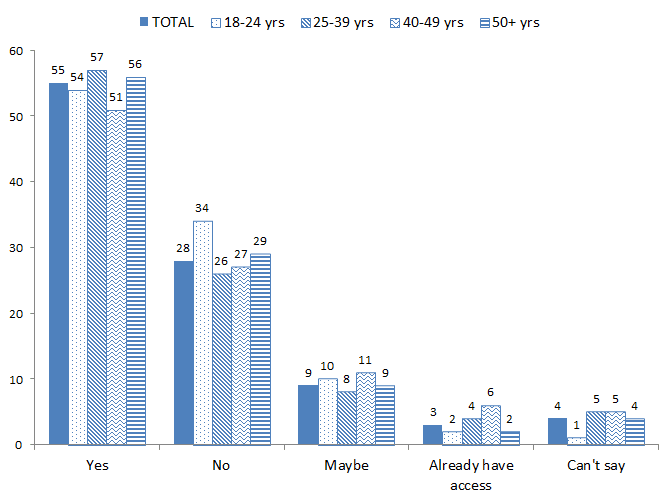
Consistent with the findings of the previous question, younger people were more likely than those from older age groups to provide their personal information in return for discounts with more than half (56%) saying they’d be likely to do this. Similarly, higher proportions of those earning $60,000 or more, and those with a diploma or some university education were more likely than their counterparts to trade personal information for discounted purchases. These differences can be seen in the following figure.
Figure 8: The percentage willing to provide personal information in return for discounted purchases, by education, income and age
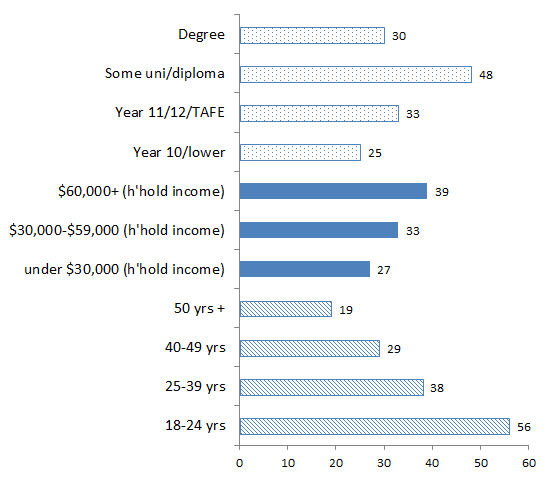
There were no significant differences across state or location.
4.13 Likely to provide personal information in return for more efficient service
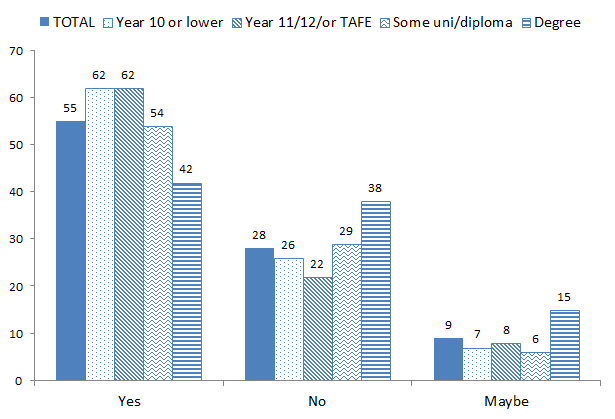
While 32% were willing to provide personal information in return for discounts, 43% were willing to provide personal details in return for more efficient and personalised service while 39% were not, 12% were unsure and 7% said it depended on the organisation.
Again, higher proportions of younger people were more likely to agree to trading personal information in return for personalised service with 63% of the 18 to 24 age group likely to do this and 51% of those aged 25 to 39 years compared to around one-third from each of the other age groups.
People in capital cities were slightly more likely than those in either regional or rural locations to part with their personal details in return for personalised service (44% cf. 34% in regional locations and 43% in rural), as were those earning $60,000 or more (50% cf. 43% average) and those with some university education or a diploma (53%). These differences can be seen in the following figure.
When comparing states, Northern Territory, Tasmania and Western Australia had slightly higher proportions of people who were willing to provide their personal information in return for personalised service (54%, 50% and 49% respectively cf. 43% average).
Figure 9: The percentage willing to provide personal information in return for more efficient and personalised service, by education, income and age
4.14 Attitude towards the transfer of personal information without owner’s knowledge
In order to gauge people’s expectations in relation to privacy issues, they were asked to rate their level of concern with regards to various practices involving the use of personal information.
The first scenario (below) involved the transfer of personal information from one retailer to another without informing the owner of the information:
You provide your personal information, such as your name, age, address, & interests, to a large retailer where you regularly shop. The retailer transfers your personal information to another retailer without your knowledge.
while the second involved a financial organisation using personal information for a purpose other than that which was originally intended:
You provide your personal information, such as name, address, number of dependents & living circumstances, to a bank for the purposes of a car loan. Two years later you apply for a home mortgage and the bank uses this information as part of their assessment of you without your knowledge or permission.
The responses to these scenarios are detailed below.
4.15 Attitudes towards transferring personal information
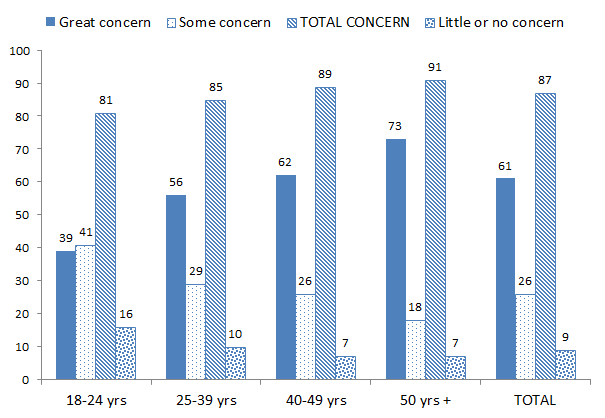
The vast majority (87%) of people said they would be concerned if a large retailer transferred their personal information to another retailer without their knowledge. For almost two-thirds of people (61%), this practice would be of great concern, with only 9% showing little or no concern at all.
Younger people, although still concerned, were less likely to be greatly concerned (39%) while those aged 50 years and over were significantly more likely to record high levels of great concern (73%). Responses to this questions, by age, are shown in the following figure.
Figure 9: Level of concern about the transfer of personal information without owner’s knowledge, by age
No significant changes were recorded between men or women, nor across location. States were also fairly similar ranging from a high of 91% rating concern in Queensland to 84% in Tasmania.
Interestingly, although the figure remained high, those with a household income of $60,000 or more were less likely to be greatly concerned about the transfer of personal information without their knowledge (53% cf. 61% average), as were those who had attended some university or had a diploma (53%) or a degree (57%). Figures remained high however, with more than half of each of these sub-groups recording great concern at the practice of transferring personal information without the owner’s knowledge.
4.16 Attitude towards the use of personal information for reasons other than that which was originally intended
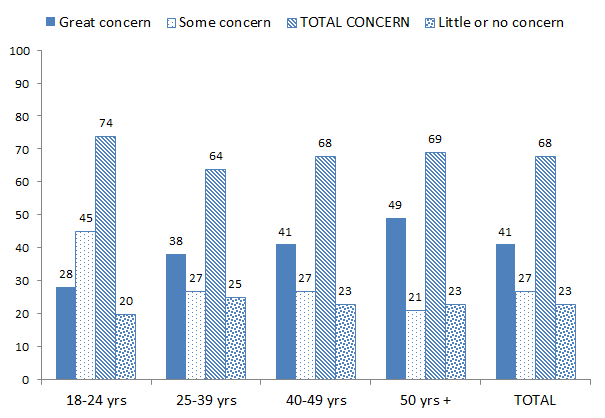
Similarly, the practice of using information for a purpose other than that which was originally intended was of concern for 68% of the population with 41% recording great concern, and 23% recording little or no concern.
While young people (18 to 24 years) were less likely to record great concern at this practice (28% cf. 41% average), overall this group had the highest percentage who were concerned (74%).
Figure 10: Level of concern with regard to using personal information beyond the purpose for which it was originally collected, by age
Women were more likely than men to be concerned at this practice (70% cf. 66% of men), with one-quarter of men registering little of no concern compared to 22% of women.
When looking at results across income, slightly lower percentages of those earning $60,000 or more were concerned about the practice of using personal information beyond the original reason it was collected for (66% cf. 73% of those earning under $30,000), while in terms of education, lower percentages concerned with this practice were found among those who completed year 11/12 or TAFE (63% cf. 68% average).
While there were no significant differences across locations, some minor differences emerged across states with those living in NSW (73%) and Western Australia (73%) more likely to be concerned at this practice while those in the Northern Territory were the least likely to be concerned (55%), and conversely, the most likely to record little of no concern (35% cf. 23% average).
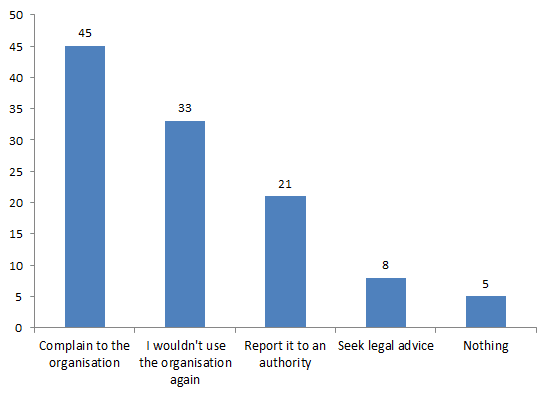
4.17 What people would do if they believed their personal information was misused by an organisation
The vast majority of people (95%) were prepared to act if they believed a company they were dealing with was misusing their information. When asked what they’d do in such a circumstance 45% said they’d make a complaint to the organisation and one-third (33%) said they would not deal with an organisation again. Other reactions included reporting it to the ombudsman or another authority (21%); or seeking legal advice (8%). Only 5% said they’d do nothing.
These responses can be seen in the following figure.
Figure 11: How people would respond if they believed an organisation they were dealing with was misusing their personal information
Differences among sub-groups in relation to this question include the following:
Those aged 40-49 were more likely than other age groups to make a complaint to the organisation (49% cf. 45% average), while higher percentages of those aged 50+ said they wouldn’t deal with the company again (37% cf. 33% average);
Women were more likely than men to say they’d make a complaint to the organisation involved (53% cf. 38%) and men were more likely to say they seek legal advice (10% cf. 5% of women);
The youngest age groups (18 to 24 years) were less likely to make a complaint to the organisation involved and slightly more likely than other age groups to say they’d do nothing about it. The figure remained low, however, at 7%. Younger people also had higher percentages who said they didn’t know what they’d do (13% cf. 9% average);
While one-third of people said they wouldn’t use the organisation again, this figure was slightly higher in rural areas at 36%;
Those on a household income of $60,000 or more were more likely to make a complaint to the organisation (54% cf. 44% of those earning under $30,000 and 43% of those on $30,000-$59,000), as were those with a degree (56% cf. 45% average);
Those with a degree were also more likely to say that they’d report it to the ombudsman or some other authority (26% cf. 21% average), while a slightly higher proportion of those with year 10 or lower education said they seek legal advice (11% cf. 8% average);
There were no significant differences across states.
4.18 Knowledge of privacy laws
In order to test respondents’ level of knowledge with regards to current privacy laws, 3 statements were read out and respondents asked to state whether each was true or false.
These statements read to respondents included the following:
Charities, private schools, private hospitals and other non-government organisations are free to sell or transfer customer lists containing personal details to other organisations. Is this statement true or false?
The way government departments or government agencies collect, protect and use people’s personal information is up to the individual departments as they are not bound by any federal privacy laws or legislation. Is this statement true or false?
Banks, insurance companies and other financial organisations are NOT currently bound by privacy laws which restrict the way they can use their customers’ personal details. Is this statement true or false?
A fourth statement concerning perceptions as to whether or not businesses often transferred or sold mailing lists to other businesses was also included.
- Customer details held by commercial organisations are often transferred or sold in mailing lists to other businesses. Is this statement true or false?
Of the 3 knowledge-based statements, results show that:
- 7% gave correct responses to all 3 statements;
- 30% gave correct responses to 2 statements;
- 38% had 1 correct; and
- 24% had none correct.
In relation to the statement regarding the regular transfer of customer details to other businesses, 84% thought this to be the case while 7% thought it didn’t happen and 9% couldn’t say.
Differences between sub-groups, in relation to responses to the statements, show that:
those aged 25 to 39 years or 40 to 49 years were more likely to give 2 or 3 correct responses, while those aged 18 to 24 appear somewhat less knowledgable (32% gave 2 or 3 correct answers compared to 39% of the 25-49 year age group);
men appear to have slightly higher knowledge levels than women with 39% getting 2 or 3 statements correct compared to 36% of women (10% of men had all 3 questions correct compared to 5% of women);
high income earners ($60,000 or more) and those with some university education/diploma or a degree were more slightly more likely than their counterparts to get 2 or 3 statements correct (48% and 44% respectively cf. 37% average).
Responses for each of the 4 statements can be seen in the following table.
| Statement | Result |
|---|---|
Charities, private schools, private hospitals and other non-government organisations are free to sell or transfer customer lists containing personal details to other organisations.
| 38% correct 37% wrong 25% couldn’t say |
The way government departments or government agencies collect, protect and use people’s personal information is up to the individual departments as they are not bound by any federal privacy laws or legislation.
| 46% correct; 27% wrong; 27% couldn’t say |
Banks, insurance companies and other financial organisations are NOT currently bound by privacy laws which restrict the way they can use their customers’ personal details.
| 37% correct 34% wrong 30% couldn’t say |
Customer details held by commercial organisations are often transferred or sold in mailing lists to other businesses.
| 84% believed this 7% thought not 9% couldn’t say |
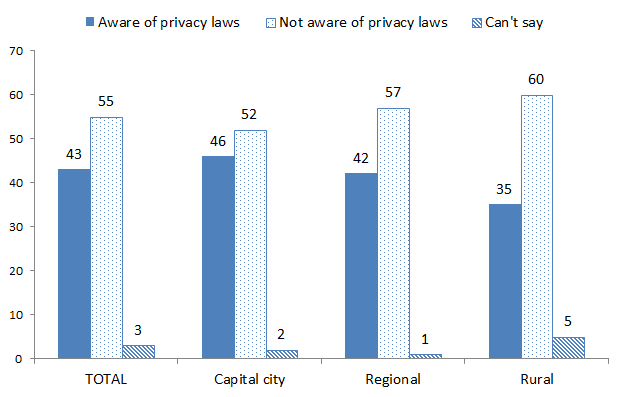
4.19 Awareness of federal privacy laws
Just over two in five (43%) people were aware that federal privacy laws existed while 55% were not and 3% couldn’t say.
Those aged 18 to 24 years were the least likely age group to know about the laws (25% awareness) while those aged 40 to 49 years had the highest percentage aware of them (47%).
More men than women were aware that privacy laws existed (46% cf. 40%), while awareness was higher in capital city locations (46%) and lower in rural areas (35%). These results can be seen in the following figure.
People on a higher household income ($60,000 or more) were more likely to be aware of the privacy laws (48%) while those earning under $30,000 were less likely (36%). Those with higher levels of education (completed some university/ has a diploma, or have a degree) were also more likely to be aware of the privacy laws than those with lower levels of education (54% of those with some uni or a diploma and 51% of those with a degree).
Awareness across states was highest in Western Australia, 51%, and lowest in South Australia, 38%.
4.19.1 Awareness of who the laws applied to
While 43% were aware that privacy laws existed, around 1 in 10 (13%) knew which organisations the laws applied to. As with general awareness of the laws, awareness was slightly higher among respondents aged 40 to 49 years (17%) and lower among the youngest aged group (8%).
Again, capital city respondents had slightly higher level of awareness concerning who the laws applied to (15% cf. 11% in both regional and rural locations), as did those in the higher income bracket (15%) and those who had some university or a diploma (20%).
As in the previous question, Western Australians (18%) appear to have slightly higher levels of awareness with regards to the privacy laws (although Victoria was the state which had the highest percentage of people who knew how the laws applied in practice), while again, South Australia had slightly lower (8%).
4.20 Level of knowledge about rights to protect privacy
When asked how much they know about their rights to protect their personal information:
- 3% said a lot;
- 15% said an adequate amount;
- 29% said some;
- 46% said very little; and
- 6% said they knew nothing.
Young people (18 to 24 years) were more likely to say they knew very little about their rights (52%) as were those with lower levels of education (52% of those who completed year 10 or below). People with a degree were more likely to say they had adequate knowledge about their rights, however, this figure remained relatively low with 1 in 5 believing they had an adequate or high level of knowledge concerning their rights when it came to protecting their personal information.
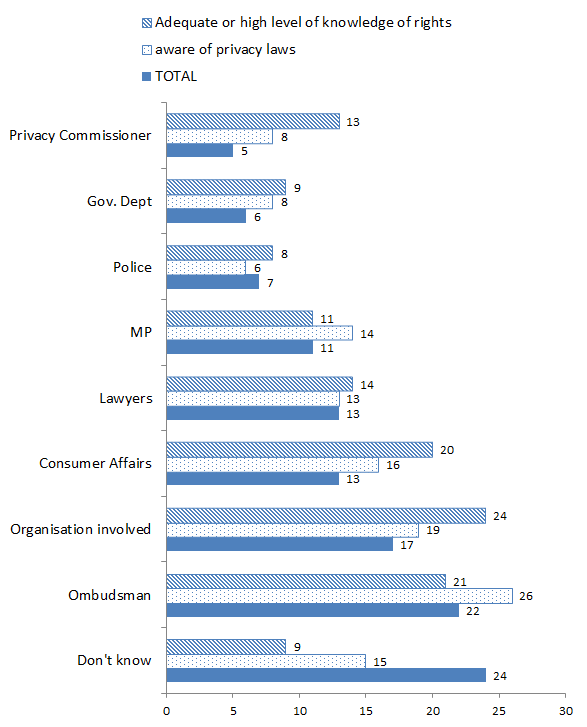
4.21 Reporting misuse of personal information
When asked to whom they’d report the misuse of their personal information, approximately one-quarter of the population (24%) said they didn’t know who they’d report it to. The remaining three-quarters, however, mentioned the following authorities or organisations, with 5% mentioning the Privacy Commissioner:
- Ombudsman (22%);
- The organisation involved (17%);
- Consumer affairs (13%)
- Lawyer /solicitor (13%);
- Local or state MP (11%);
- The police (7%);
- State government department (6%);
- The Privacy Commissioner (5%);
- Media, local council, seek advice from family or friends (1% each).
People in New South Wales and those with a household income of $60,000 had higher proportions who said they report a privacy breach to the Privacy Commissioner. This figure was less than 1 in 10, however, at 9%. (It should be noted that the question did not differentiate between state or Federal Commissioners. Hence awareness could relate to the Privacy Commissioner at State or Federal level.)
Those with a degree or who had attended some uni/or had a diploma also had slightly higher-than-average percentages who said they’d report a breach to the Privacy Commissioner (7% and 8% respectively).
Those people who earlier reported awareness of the privacy laws had higher percentages who mentioned the Privacy Commissioner (8% cf. 2% who weren’t aware of the laws) as did those who said they had adequate or high levels of knowledge concerning their privacy rights (13% cf. 2% of those who had little of no knowledge).
The differences in behaviour, on the basis of awareness and knowledge of privacy laws, is shown in the following figure.
Figure 13: Who people would report a privacy breach to, by level of awareness and knowledge of privacy rights
4.22 Data matching
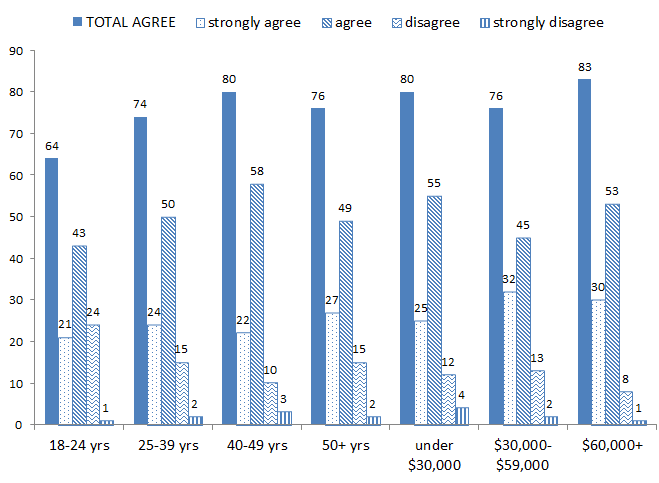
Three-quarters of people (75%) agreed with data matching as a means of reducing fraud within government payment systems while 18% disagreed. Of those who agreed, 24% strongly agreed.
Interestingly, people aged 18 to 24 years were less likely to agree (64% cf. 75% average) with this practice and more likely to disagree (25% cf. 18% average), as were those with year 10 or below education and those with some uni/diploma (68% agreed and 22% disagreed).
Those with a household income of $60,000 or over were more likely than those in other income groups to support data-matching (83% cf. 80% of those earning under $30,000 and 76% of those on $30,000-$59,000).
When looking at results across states, those in Western Australia were more likely to support data matching (86%) while those in Victoria were the least likely (70%).
Results across age and income sub-groups are shown in the following figure.
4.23 Allocating one number for use across all government departments
Respondents were asked whether they agreed or disagreed with the idea that each individual should have an allocated number for use across government agencies and departments. The question put to respondents was as follows:
Could you please tell me if you agree or disagree with the following statement: All individuals on Commonwealth government data bases such as Immigration, Centrelink, the tax office and Medicare should be allocated one number each and that number should be used for all their dealings with any government department.
Somewhat surprisingly 70% of people agreed with this concept. This result, however, was not supported by the qualitative findings and should be treated with caution as we believe the placement of the question (ie following on from questions relating to the reduction of fraud in government departments) has resulted in respondents interpreting it within a fraud- reduction context. In addition, the type of government departments mentioned in the question such as Centrelink, Immigration, the Tax Office and Medicare may have also led respondents to relate the question to fraud reduction and hence to respond with this view in mind. In the qualitative research, discussion on the one-number concept often lead to concerns regarding the consolidation of information and the potential for organisations to build comprehensive profiles without an individual’s knowledge. This topic also triggered memories of the Australia Card and the ‘big brother’ issues surrounding such a concept. While initially people saw the administrative advantages of a unique number, as certain group members (ie those with awareness of the deeper issues) began to raise their concerns about the concept, most group participants heavily qualified their support for the concept or backed away from it altogether.
Results to the survey question, however, show that men were more likely than women to agree with the concept (74% cf. 65% of women) as were people in rural locations (77% cf. 66% of those in capital cities), and those on household a income of $60,000 or more (74% cf. 70% average).
When looking at education sub-groups those with lower levels of education (year 10 or lower) were more likely to support the idea (78% cf. 70% average) while those with a degree were less likely to support the concept (64% cf. 70% average) and, conversely, had the highest proportion who disagreed, with almost third of this group (31%) registering disagreement.
4.24 One number to track health care services
In order to enable the government to better track the use of health care services, four out of five people (81%) agreed (including 23% who strongly agreed) that individuals should have a number allocated to them for use when accessing any type of health service. A total of 13% disagreed with this concept and 6% were undecided.
Again, it is suspected that many people answered this question within a fraud-prevention context as discussions in the qualitative phase revealed relatively high levels of concern about a database that contained people’s health information. As such, support for a ‘health information network’ was heavily qualified by respondents with regards to adequate security and restricted access.
However, responses to the survey questions showed that younger people were less likely to strongly agree with this idea (15%), while those aged 50+ were more likely to strongly agree (27%).
Men were more likely than women to strongly agree (26% cf. 20%), and to agree with the idea overall (83% cf. 79%), while higher percentages of agreement came from people who lived in rural areas (86%) compared to those living in regional areas (77%) and in capital cities (80%).
While there were no significant differences on the basis of income, differences existed across education levels with those who had a degree being less likely to agree with the concept (74% cf. 81% average) and more likely to disagree with it (19% cf. 13% average).
Victorians were the least likely to agree with the one number concept (75%) while Queenslanders had the highest percentage who agreed (88%).
4.25 Inclusion in a national health database
If a national health database were to exist, 66% of people believed that individual inclusion in the database should be voluntary while 28% believed that all medical records should be entered as a matter of course, and 4% couldn’t say.
Those more likely to believe inclusion should be mandatory were:
- people aged 50+ years of age (33%);
- men (31%);
- those in rural areas (32%); and
- those with year 10 or below level of education (38%);
while those more likely to believe inclusion should be voluntary included:
- respondents aged 18 to 24 years (72%) and 25 to 39 years (70%);
- women (69%); and
- those with a degree (74%).
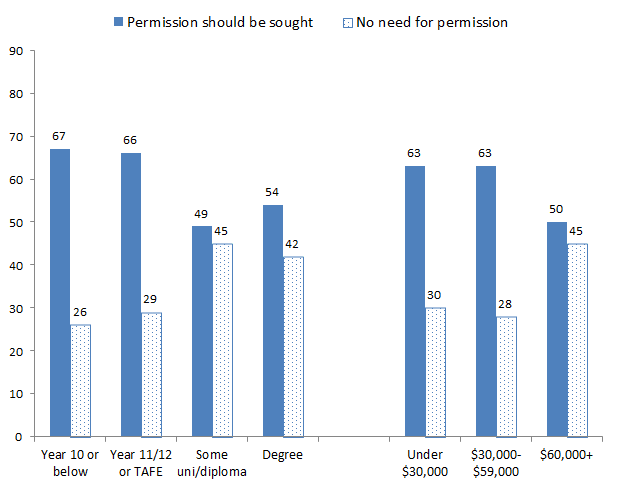
4.26 Using unidentified information for health research
More than half the population (61%) thought that an individual’s permission should be sought before using their unidentified health information for research purposes. One-third (33%) thought permission wasn’t necessary and 4% said maybe.
Slightly higher percentages supporting permission were among those aged 18 to 24 and 25 to 39 years of age (63% and 65% cf. 61% average), women (64% cf. 59% of men), and people in rural areas (67% cf. 59% in capital cities).
While people on lower incomes and with lower levels of education were more likely to believe that permission should be sought before using unidentified health information, those on higher incomes and with higher education levels were less likely to see permission as necessary. These differences can be seen in the following figure.
Figure 17: The percentage of people who think permission should be sought before using unidentified health information for research purposes, by education and income
4.27 Agree with doctors discussing their details without consent
When asked whether health professionals should be able to discuss the medical details of an individual (in order to better treat them) – in a way which identified them – without the patients consent, results were split with just over half (53%) agreeing and 41% disagreeing.
Those aged 50+ years were more likely to agree (58%), while those aged 25 to 39 were less likely to do so (49%). Men were also more likely to agree (58% cf. 49% of women) while women were more likely to disagree that health professional should be able to do this (46% cf. 36% of men).
No significant differences emerged across location or income sub-groups, however, the education variable showed some differences with people who had lower levels of education more likely to agree with the statement (60% of those with year 10 or lower education) while those with a degree were split with 47% agreeing and 47% disagreeing. Hence this sub-group had the highest proportion of people who disagreed with the idea of medical staff discussing a patient’s condition or treatment – in a way that identified them - without their consent.
4.28 Police access to personal information databases
Although data matching to prevent fraud was heavily supported by the community (75%), as was the tracking of health care services (81%), when asked whether police should have access to databases containing personal information on all Australians if it meant that twice as many crimes could be solved, a much lower level of support emerged with just over half (55%) agreeing with the idea. The results to this question, by age, can be seen in the following figure.
Figure 14: The percentage of people who believe that police should have access to databases containing personal information if it meant that twice as many crimes could be solved, by age
As seen in the figure above, 18 to 24 year-olds had higher percentages who opposed the idea of police accessing databases containing personal details of citizens, and those aged 40 to 49 had lower percentages actively supporting the idea (51%).
While results across sex and location were fairly similar, differences emerged across income and education with those earing under $30,000 (64%) and those with lower levels of education more likely to support the idea, while people with a degree had the highest proportion of any sub-group to disagree (38%). Differences on the basis of education can be seen in the following figure.
Figure 16: The percentage of people who believe that police should have access to databases containing personal information if it meant that twice as many crimes could be solved, by education level
In relation to states, those in the Northern Territory and Tasmania were more likely than those in other states to agree to police access to personal information databases (63% and 62% cf. 55% average).
4.29 Practices regarded as an invasion of privacy
The vast majority of community members (90% and over) regarded each of the following scenarios to be an invasion of privacy:
Scenario 1: A business that you don’t know gets hold of your personal information.
95% of the population saw this as an invasion of privacy.
Scenario 2: A business monitors your activities on the internet, recording information on the sites you visit without your knowledge.
90% of the population saw this as an invasion of privacy.
Scenario 3: You supply your information to a business for a specific purpose and the business uses it for another purpose.
94% of the population saw this as an invasion of privacy.
Scenario 4: A business asks you for personal information that doesn’t seem relevant to the purpose of the transaction.
93% of the population saw this as an invasion of privacy.
While percentages of those who regarded each scenario as an invasion of privacy were high across all sub-groups, minor differences to emerge are as follows:
Slightly fewer men than women regarded scenarios 1,2 and 4 as a breach of privacy, however figures remained in the high eighties or low nineties;
Those in the middle and high income bracket and people in capital city locations were slightly less likely to regard monitoring internet activities as a breach of privacy while those in regional areas had higher percentages who thought this activity was a breach – (89% of those in capital cities compared to 94% of those in regional areas regarded this activity as a breach, while 2% of people earning $30,000-$59,000 and 10% of those on $60,000+ thought this activity was not a privacy breach);
People in the highest income bracket were slightly less likely to regard scenario 4 as a privacy breach (7% did not regard this as a privacy breach compared to 5% average).
The responses given for each scenario are shown in the following figure.
Figure 18: The percentage of people who regard the following scenarios/activities an invasion of privacy
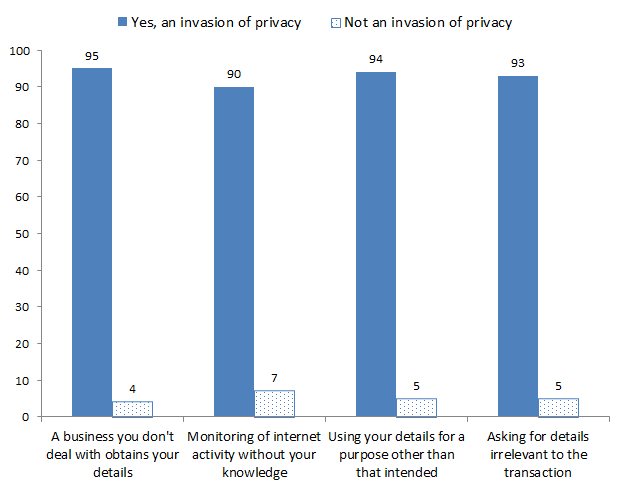
4.30 Using public lists for marketing purposes
While 70% of the population thought that the electoral role should not be accessed for marketing purposes, people were split on the use of the White Pages telephone directory with 42% agreeing that the directory should be accessible to marketers and 46% believing that it shouldn’t be. These results are shown in the following figure.
Figure 19: The percentage of people who agree or disagree with use of the electoral role or telephone directory for marketing purposes
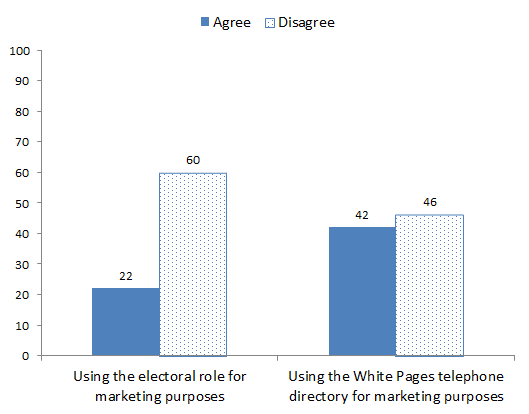
The following tables shows the sub-groups who were more likely to support or disagree with using the public lists for marketing purposes.
| Electoral Role | Telephone directory | |
|---|---|---|
| Sub-groups more likely to be against using this |
|
|
| Sub-groups more likely to agree with using this |
|
|
4.31 The internet
Questions regarding privacy and the internet were only asked of 51% of respondents, ie those who used the internet at home, work or a place of study at least once a week.
4.31.1 More concerns about the security of personal information when using the internet
More than half of all internet users (57%) had more concerns about the security of their personal information when using the internet, while around one-third (31%) had the same level of concern and 8% fewer concerns. These results are graphed in the following figure.
Figure 20: The percentage of internet users who have more or fewer concerns about the security of their personal information when using the internet
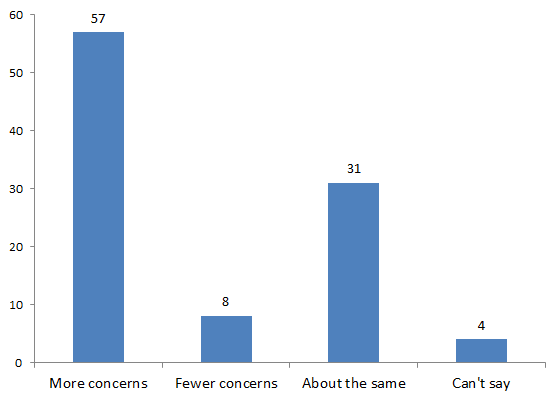
Base: those who use the internet at least once a week – 780 respondents
Interestingly, men were more likely than women to say they had more concerns about their personal information when using the internet (59% cf. 55%), as did people in the 25 to 39 year age group (65% cf. 57%). (It is interesting to note that, other than the 50+ age group, the 25 to 39 years age group had the lowest incidence of internet users (59% cf. 66% of users in both the 18 to 24 and 40 to 49 years age group. Of the 50+ age group, 30% were classified as internet users).
Approximately 52% of those with a household income of under $30,000 and those on $30,000 to $59,000 said they had more concerns when using the internet, compared to 60% of those with a household income of $60,000.
Larger percentages of people with some uni/ or a diploma said they had fewer concerns (20% cf. 8% average), while those with year 10 or below education were more likely to say their concerns were the same (42% cf. 31% average). This group also had lower percentages of those who said they had increased concerns when dealing over the internet (45% cf. 57% average).
4.31.2 Set browser to reject cookies
Just under one-third of internet users (27%) said they had set their web browser to reject cookies while 38% had not, and 34% were not sure or didn’t know what ‘cookies’ were.
- The only significant differences across sub-groups included the following:
- Those aged 25 to 39 years had a slightly higher proportion who had set their web browser to reject cookies (33% cf. 27%);
- More women than men didn’t know what cookies were (32% cf. 20% average);
- A higher proportion of people with a degree (31%) and those earning $30,000 to $59,000 had set their browser to reject cookies (28% cf. 23% of those earning under $30,000 and 22% of those earning $60,000);
- Those with an education level of year 10 or below were more likely than other groups not to know what cookies were (40% cf. 25% average), and higher percentages of those aged 50+ also fell into this category with 33% not knowing what a cookie was.
4.31.3 Giving false information when completing forms over the internet
When internet users were asked whether they ever gave false information when completing forms over the internet the following results were obtained:
- 6% said always;
- 7% said often;
- 17% said sometimes;
- 10% said rarely;
- 51% said never; and
- 9% couldn’t say.
Younger internet users (18 to 24 years) were twice as likely as other age groups to often provide false information (15% cf. 7% average), while almost two-thirds of those aged 40 to 49 years (63%) and 60% of those aged 50+ said they never gave false information. The higher propensity among young people to give false information over the internet perhaps reflects the ease and confidence with which many young people handle this medium. Regional internet users were also slightly more likely than their counterparts to often or always provide false information (20% cf. 13% average).
Around one-fifth of those (21%) with a household income of $60,000 or more said they sometimes provided false information (compared to 14% of those earning under $30,000), while those in the lower income bracket had the highest percentage who said they never gave false information (61% cf. 51% average).
4.31.4 Privacy Policy
Just over half of all internet users (55%) had seen or read the privacy policy attached to an internet site while 43% hadn’t. Of those who had seen or read the privacy policy:
- 18% said they felt more positive or confident about the site;
- 4% said it made them more cautious about using the site;
- 3% said they trusted the organisation more;
- 3% said they respected the organisation more for having it;
- 3% said it showed the organisation was doing the right thing;
- 2% said it was too long and complicated to read; and
- 54% said it made little or no difference.
As can be seen in the figure below, twice as many women as men (26% cf. 13%) said seeing a privacy policy made them more confident about the site.
Figure 21: The effect of seeing a privacy policy on an internet site
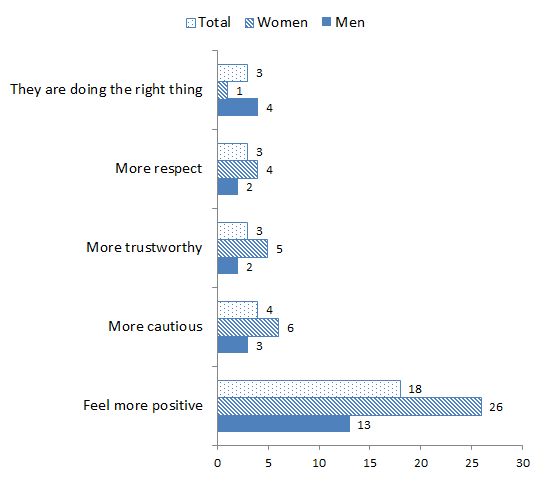
Attachment A
Current behaviour
1. When completing forms or applications that ask for personal details, such as your name, contact details, income, marital status etc, how often, if ever, would you say YOU LEAVE SOME QUESTIONS BLANK as a means of protecting your personal information?
2. Have you ever decided NOT TO DEAL with a private company or charity because of concerns over the protection or use of your personal information?
2a. Have you ever decided NOT TO DEAL with a government organisation or agency because of concerns over the protection or use of your personal information?
3. When providing your personal information to organisations, IN GENERAL, what type of information do you feel MOST RELUCTANT about handing over.
IF MORE THAN ONE RESPONSE ON Q3, ASK:
4. And of (READ OUT ALL MENTIONED IN Q ) which ONE of these would you be MOST RELUCTANT to provide?
5. And what is your main reason for not wanting to provide this type of information?
6. Which of the following statements BEST DESCRIBE how you GENERALLY feel when organisations that you have NEVER DEALT WITH BEFORE send you unsolicited marketing information or junk mail?
- I feel angry and annoyed
- I feel concerned about where they got my personal information
- It doesn’t bother me either way, I don’t care.
- It’s a bit annoying but it’s harmless.
- I enjoy reading the material and don’t mind getting it at all.
- CAN’T SAY
7. Do you think that organisations should have to ASK FOR YOUR PERMISSION before using your personal information for direct marketing?
IF YES ON Q7 ASK:
8. Would you still prefer an organisation to seek permission before using your personal information for direct marketing if this involved sending you extra mail and getting you to complete permission forms?
8a. How important is it that organisations seek your permission to STORE YOUR PERSONAL INFORMATION ON THEIR DATA BASE?
8b. How important is it that organisations ADVISE YOU WHO MAY HAVE ACCESS TO YOUR PERSONAL INFORMATION?
8c. How important is it that organisations ADVISE YOU HOW YOUR PERSONAL INFORMATION MAY BE USED?
9. The next question is about how much you trust certain organisations with your personal information. How trustworthy would you say the following organisations are with regards to how they protect or use your personal information?
9a. FINANCIAL ORGANISATIONS SUCH AS BANKS, BUILDING SOCIETIES AND
CREDIT UNIONS. Would you say these types of organisations were trustworthy or untrustworthy when it comes to the protection or use of your personal information?
9b. REAL ESTATE AGENTS. Would you say these types of organisations were trustworthy or untrustworthy when it comes to the protection or use of your personal information?
9c. MAIL ORDER COMPANIES. (Would you say these types of organisations were trustworthy or untrustworthy when it comes to the protection or use of your personal information?)
9d . CHARITIES. (Would you say these types of organisations were trustworthy or untrustworthy when it comes to the protection or use of your personal information?)
9g. HEALTH SERVICE PROVIDERS, INCLUDING DOCTORS AND HOSPITALS.
Would you say these types of organisations were trustworthy or untrustworthy when it comes to the protection or use of your personal information?
9h. MARKET RESEARCH ORGANISATIONS. (Would you say these types of organisations were trustworthy or untrustworthy when it comes to the protection or use of your personal information?)
9i. RETAILERS (Would you say these types of organisations were trustworthy or untrustworthy when it comes to the protection or use of your personal information?)
9j COMPANIES SELLING OVER THE INTERNET. Would you say these types of organisations were trustworthy or untrustworthy when it comes to the protection or use of your personal information?
10. Which ONE of the following would be most likely to make you trust an organisation with your personal information?
- If the organisation has a privacy policy
- If the organisation gives you control over how your personal information is used and disclosed
- If the organisation has a good reputation for keeping personal information private
- If the organisation staff show respect for your privacy
- If you have had good past experiences dealing with the organisation
- CAN’T SAY
- PRIVACY IS NOT AN ISSUE FOR ME
11. When dealing with businesses that require your personal information which of the following service components are most important to you? Please rate them starting with the most important and finishing with the least important. ROTATE
- Convenience
- Efficiency of service
- Quality of product or service
- Price
- Respect for, and protection of, my personal information
- C/s
12. GENERALLY, how likely or unlikely would you be to provide your personal information to an organisation if it meant you would receive discounted purchases?
13. GENERALLY, how likely or unlikely would you be to provide your personal information to an organisation if it meant you would receive more efficient and personalised service?
To what extent, if any, does or would the following practices concern you.
14. You provide your personal information, such as your name, age, address, & interests, to a large retailer where you regularly shop. The retailer transfers your personal information to another retailer WITHOUT YOUR KNOWLEDGE. Would you say this practice is of: READ OUT …. ROTATE RESPONSES
15. You provide your personal information, such as name, address, number of dependents & living circumstances, to a bank for the purposes of a car loan. TWO YEARS later you apply for a home mortgage and the bank uses this information as part of their assessment of you WITHOUT YOUR KNOWLEDGE OR PERMISSION
Would you say this practice is of
- Great concern
- Of some concern
- Neither of great or little concern
- Of little concern only
- Of no concern at all
- C/s /HAVEN’T THOUGHT ABOUT IT
16. If you believed an organisation such as your bank or an insurance company misused your personal information in a way that breached your privacy, what, if anything, would you be likely to do?
5. Level of knowledge
The next few questions are about current practices regarding the use and security of customers’ personal information. Please state whether you think the following statements are true or false. If you don’t know, or haven’t really thought about it, just say “Can’t say.”
17. “Customer details held by commercial organisations are often transferred or sold in mailing lists to other businesses.”
Would you say this statement was true or false?
18. “Charities, private schools, private hospitals and other non-government organisations are free to sell or transfer customer lists containing personal details to other organisations.” Would you say this statement was true or false?
19. “The way government departments or government agencies collect, protect and use people’s personal information is up to the individual departments as they are not bound by any federal privacy laws or legislation.”
Would you say this statement was true or false?
20. “ Banks, insurance companies and other financial organisations are NOT currently bound by privacy laws which restrict the way they can use their customers’ personal details.”
Would you say this statement was true or false?
21. That was the last true or false statement. Currently privacy laws do exist. The laws outline procedures for the collection, use and storage of people’s personal information and apply to federal government departments and agencies, as well as to financial organisations. They do not yet apply to other businesses. Were you aware of the privacy laws before this interview?
21b. Were you aware of what organisations the privacy laws applied to, before this interview?
22. How much would you say do you know about your rights when it comes to protecting your personal information ?
23. If you wanted to report the mis-use of your personal information, who would you be most likely to contact?
24. Are you aware that a Federal Privacy Commissioner exists to uphold privacy laws and to investigate complaints people may have concerning the misuse of their personal information ?
6. Government
25. In an attempt to REDUCE FRAUD, some government departments and agencies COMPARE INFORMATION HELD IN THEIR DATABASES in a process called DATA MATCHING. For example, a couple of times a year information held by Social Security is matched with Tax Office records to check that benefits and pensions are going to people entitled to them. Do you agree or disagree with using people’s personal information in this way? And would that be strongly agree/disagree or just agree/disagree?
26. Could you please tell me if you agree or disagree with the following statements:
All individuals on commonwealth government data bases such as immigration, Centrelink, the tax office and Medicare should be allocated ONE NUMBER EACH and that number should be used for ALL THEIR DEALINGS WITH ANY GOVERNMENT DEPARTMENT. Do you agree or disagree with this statement?
And would that be strongly agree/disagree or just agree/disagree?
27. To enable the government to better track the use of HEALTH SERVICES, all individuals should be allocated a NUMBER and that number should be used when accessing ANY health service or facility. Do you agree or disagree with this statement?
And would that be strongly agree/disagree or just agree/disagree?
28 If an additional 50 – 60% of crime could be solved, would you be happy for the police to have access to a database containing the personal information of all Australians?
7. Health information network
The next few questions concern medical or health information and privacy. Firstly, a question about a national health information database.
29. If a national health information network existed it would involve entering all medical records onto an Australian-wide database. This would allow a patient’s medical information to be easily and quickly transferred to a treating doctor anywhere in australia. such a network could also be used to gather information on national health statistics.
30. If such a database existed, do you think inclusion of your medical information should be VOLUNTARY, or should ALL MEDICAL RECORDS be entered as a matter of course?
31. Health information is often sought for research purposes and is generally de-identified - that is, NOT linked with information that identifies an individual. Do you believe that an individuals’ permission should be sought before their de-identified health information is released for research purposes, or not?
32. Do you agree or disagree that your doctor should be able to discuss your personal medical details with other health professionals – in a way that identified you - WITHOUT YOUR CONSENT if they thought this would assist your treatment? And would that be strongly agree/disagree or just agree/disagree?
33. Which of the following instances would you regard to be an invasion of the privacy of your personal information? READ OUT STATEMENTS BELOW AND HIGHLIGHT THOSE RESPONDENT CONSIDERS TO BE AN INVASION OF PRIVACY. IF NECESSARY SAY: Would you say this was an invasion of the privacy of your personal information? AFTER EACH STATEMENT.
A business that you don’t know gets hold of your personal information. IF NECESSARY SAY: Would you say this was an invasion of the privacy of your personal information?
34. A business monitors your activities on the internet, recording information on the sites you visit without your knowledge.
35. You supply your information to a business for a specific purpose and the business uses it for another purpose.
36. A business asks you for personal information that doesn’t seem relevant to the purpose of the transaction
The next couple of questions concern the type of public information that should or should not be available to businesses for marketing purposes.
37. Do you agree or disagree that businesses should be able to use the electoral roll for marketing?
And would that be strongly agree/disagree or just agree/disagree?
38. Do you agree or disagree that businesses should be able to collect your information from the White Pages telephone directory without your knowledge for the purposes of marketing?
And would that be strongly agree/disagree or just agree/disagree?
8. Internet
39. The next few questions concern the internet. Do you use the internet at home or work AT LEAST ONCE A WEEK?
IF YES
40. GENERALLY, when dealing over the internet, would you say you have MORE CONCERNS about the security of your personal information than usual, fewer concerns or about the same ?
41. Do you have your web browser set to reject cookies? If you don’t know what this means, just say so as this is of interest as well.
42. When completing online forms or applications that ask for personal details, how often, if ever, would you PROVIDE FALSE INFORMATION as a means of protecting your privacy?
43. Have you ever seen or read the privacy policy attached to any internet site? IF YES ON Q43 ASK:
44. What impact, if any, did seeing or reading these privacy policies have upon your attitude towards the site?
Attachment B
The following pages outline results from some of the questions included in a 1994 survey of privacy attitudes [Results are from the ‘Privacy Act Survey’ conducted by Roy Morgan Research in 1994 on behalf of the then Human Rights and Equal Opportunity Commission] and compares them with findings from the 2001 survey. Please note, however, that while the questions from each survey are similar they are not strictly, directly comparable as the exact wording and rating scales were not mirrored in each survey.
Awareness of Privacy Laws — 1994 to 2001
In 1994 a question asking about the privacy laws showed that 36% of people were aware of the laws. A similar question in this year’s survey showed that awareness had increased to 43%. These results can be seen in the following figure.
Awareness of Privacy Laws among the adult population, 1994 and 2001
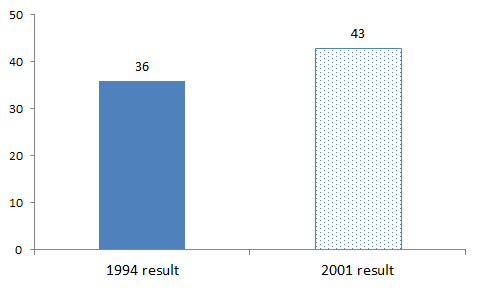
Knowledge of Privacy Act
In 1994, survey questions examining people’s level of knowledge concerning the Privacy Act showed that 31% of people were aware that financial records were controlled by the Act, and 32% were aware that Federal Government records were controlled by the Act. Similar knowledge-testing questions in the 2001 survey (although the questions were not identical) indicate slightly higher levels of knowledge about the Act with 37% believing financial organisation to be controlled by the Act and 46% believing government were also controlled by the Act.
| Knowledge of Act | 1994 | 2001 |
|---|---|---|
| Aware that Privacy Act controls Financial (banks, insurance etc) records | 31 | 37 |
| Aware that Privacy Act controls Federal Gov. records | 32 | 46 |
Where would people go to report a privacy breach
As can be seen in the following figure, the number of people who would report a privacy breach to the police has halved since 1994 (17% to 7% in 2001), while mentions of the Ombudsman (14% in 1994 to 24% in 2001) and Members of Parliament (7% in 1994 to 13% in 2001) have increased significantly. Reports to the Privacy Commission have also increased, doubling from 2% in 1994 to 5% in 2001.
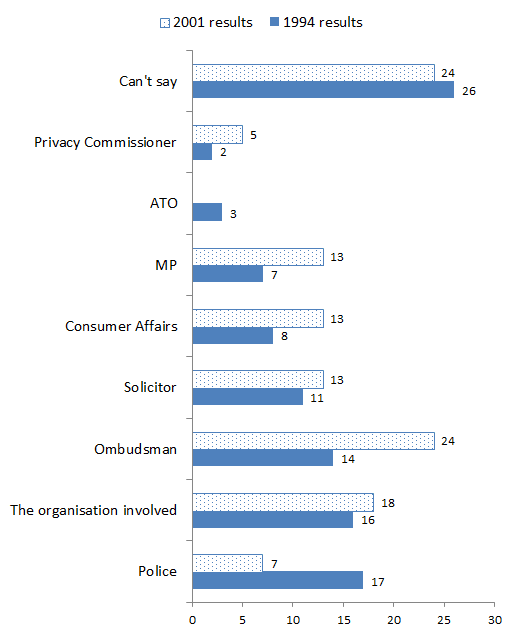
Trustworthiness of various types of organisations
The following table shows responses to questions which asked about the level of trust people felt for various organisations in relation to the protection of use of their personal information. While it appears that levels of trust have generally increased, it must be remembered that the question wording differed in each survey and therefore no definite conclusions can be drawn.
| Type of organisation | 1994 (% who were satisfied or fully satisfied to trust organisation with information) | 2001 (% who think these organisation is somewhat or highly trustworthy) |
|---|---|---|
| Doctors, hospitals etc | 70% | 84% |
| Financial organisations such as banks, credit unions, etc | 42% | 59% |
| Market research companies | 29% | 32% |
Use of public records for marketing purposes
The 1994 survey asked a general question about companies obtaining public record lists for marketing while the 2001 survey asked specifically about businesses using the Electoral Role an the White Pages telephone directory.
Results in 1994 showed that:
- 15% thought it was okay for businesses to obtain public lists;
- 31% thought it was a cause for concern; and
- 54% disagreed with it outright.
Results in 2001 showed that:
- 22% thought using the electoral role for marketing purposes was okay, 70% disagreed;
- 42% supported use of telephone lists for marketing, 46% disagreed.
Again, while results cannot be strictly compared, they may indicate a slightly more tolerant attitude towards marketing. Possibly the proliferation of direct marketing has lead people to accept or at least tolerate it as part of modern life.
Long text descriptions
Figure 1: The Percentage of Respondents who had decided NOT to deal with an organisation because of concerns over the use and protection of their personal information, by age
Figure 1 is a column chart broken down by age group, showing that younger people were the least likely to refuse to deal with a company because of concerns over the use and protection of their personal information. The full results are as follows:
- 18-24 yrs: 35%
- 25-39 yrs: 42%
- 40-49 yrs: 50%
- 50 yrs +: 40%
Figure 2: Behaviour of people aware of privacy laws compared to people who are not aware of privacy laws
Figure 2 is a column chart showing that people who are aware of privacy laws are more likely to decide not to deal with an organisation because of concerns over the use and protection of personal information, as well as more likely to leave questions blank.
| Aware of privacy laws % | Not aware of privacy laws % | |
|---|---|---|
| Decided not to deal with an organisation because of concerns over use and protection of personal information | 47 | 38 |
| Often or alway leaves questions blank | 24 | 18 |
Figure 3: Responses to receiving unsolicited marketing information from organisations they have never dealt with before
Figure 3 is a column chart which shows that more than half the population were concerned about how organisations they had never dealt with before obtained their personal information to send them unsolicited marketing information. The full results are as follows:
- Concerned about where they got my details: 55%
- I feel angry and annoyed: 25%
- It’s annoying but harmless: 20%
- It doesn’t bother me: 17%
- I enjoy reading it: 9%
Figure 4: The percentage of people who think businesses should seek permission before using personal information for marketing purposes
Figure 4 is a column chart broken down by age group, showing that results were consistent fairly consistent. Younger people were more likely to forego the need for permission if it meant completing extra forms. The full results are as follows:
| Age | Should seek permission % | Should seek permission even if I have to complete extra forms % |
|---|---|---|
| 18-24 yrs | 92 | 84 |
| 25-39 yrs | 91 | 87 |
| 40-49 yrs | 94 | 90 |
| 50 yrs + | 91 | 86 |
Figure 5: The percentage of people who think it’s important to know who has access to their personal information and how their information may be used.
Figure 5 is a stacked column chart comparing who and how against levels of importance.
| important | very important | |
|---|---|---|
| It’s IMPORTANT to know WHO has ACCESS to my personal info. | 23% | 66% |
| It’s IMPORTANT to know HOW my personal info. may be used. | 24% | 68% |
Figure 6: Ways which would help people to trust an organisation with their personal information, by age
Figure 6 is a bar chart broken down by age group, showing that younger people were more likely than older ones to nominate control and having a privacy policy as ways in which a company could build trust. The full results are as follows:
| 18-24 yrs | 25-39 yrs | 40-49 yrs | 50+ yrs | TOTAL | |
|---|---|---|---|---|---|
| Staff showing respect for privacy | 40 | 40 | 37 | 41 | 40 |
| A good reputation for protecting p.i. | 48 | 49 | 47 | 43 | 46 |
| Good past experience | 50 | 46 | 46 | 47 | 47 |
| Privacy Policy | 65 | 59 | 53 | 51 | 55 |
| Giving control over how details used | 70 | 61 | 64 | 52 | 59 |
Figure 7: Ways which would help people to trust an organisation with their personal information, by income
Figure 7 is a bar chart broken down by household income, showing that those earning higher incomes were more likely to think that more control, having a privacy policy and a good reputation would help them trust an organisation with their personal information. The full results are as follows:
| under $30,000 | $30,000-$59,000 | $60,000+ | TOTAL | |
|---|---|---|---|---|
| Giving control over how details used | 58 | 59 | 69 | 59 |
| Privacy Policy | 54 | 53 | 61 | 55 |
| Good past experience | 51 | 47 | 55 | 47 |
| A good reputation for protecting p.i. | 49 | 41 | 58 | 46 |
| Staff showing respect for privacy | 52 | 37 | 43 | 40 |
Figure 8: The percentage willing to provide personal information in return for discounted purchases, by education, income and age
Figure 8 is a bar chart broken down by education, income and age, showing that younger people were more likely than those from older age groups to provide their personal information in return for discounts with more than half (56%) saying they’d be likely to do this. Similarly, higher proportions of those earning $60,000 or more, and those with a diploma or some university education were more likely than their counterparts to trade personal information for discounted purchases. The full results are as follows:
By education:
- Degree: 30%
- Some uni/diploma: 48%
- Year 11/12/TAFE: 33%
- Year 10/lower: 25%
By income:
- under $30,000: 27%
- $30,000-$59,000: 33%
- $60,000+: 39%
By age:
- 18-24 yrs: 56%
- 25-39 yrs: 38%
- 40-49 yrs: 29%
- 50 yrs +: 19%
Figure 9: The percentage willing to provide personal information in return for more efficient and personalised service, by education, income and age
Figure 9 is a bar chart broken down by education, income and age, showing that higher proportions of younger people, people earning more and people with higher levels of education were more likely to agree to trading personal information in return for personalised service. The full results are as follows:
By education:
- Degree: 40%
- Some uni/diploma: 53%
- Year 11/12/TAFE: 47%
- Year 10/lower: 37%
By income:
- under $30,000: 50%
- $30,000-$59,000: 46%
- $60,000+: 42%
By age:
- 18-24 yrs: 33%
- 25-39 yrs: 36%
- 40-49 yrs: 51%
- 50 yrs +: 63%
Figure 9: Level of concern about the transfer of personal information without owner’s knowledge, by age
Figure 9 is a column chart showing levels of concern, broken down by age group. Younger people, although still concerned, were less likely to be greatly concerned (39%) while those aged 50 years and over were significantly more likely to record high levels of great concern (73%). The full results are as follows:
| Age | 18-24 yrs | 25-39 yrs | 40-49 yrs | 50 yrs + | TOTAL |
|---|---|---|---|---|---|
| Great concern | 39 | 56 | 62 | 73 | 61 |
| Some concern | 41 | 29 | 26 | 18 | 26 |
| TOTAL CONCERN | 81 | 85 | 89 | 91 | 87 |
| Little or no concern | 16 | 10 | 7 | 7 | 9 |
Figure 10: Level of concern with regard to using personal information beyond the purpose for which it was originally collected, by age
Figure 10 is a column chart showing levels of concern, broken down by age group. While young people (18 to 24 years) were less likely to record great concern at this practice (28% cf. 41% average), overall this group had the highest percentage who were concerned (74%). The full results are as follows:
| Age | 18-24 yrs | 25-39 yrs | 40-49 yrs | 50 yrs + | TOTAL |
|---|---|---|---|---|---|
| Great concern | 28 | 38 | 41 | 49 | 41 |
| Some concern | 45 | 27 | 27 | 21 | 27 |
| TOTAL CONCERN | 74 | 64 | 68 | 69 | 68 |
| Little or no concern | 20 | 25 | 23 | 23 | 23 |
Figure 11: How people would respond if they believed an organisation they were dealing with was misusing their personal information
Figure 11 is a column chart showing that only 5% of respondents said they would do nothing. 45% said they’d make a complaint to the organisation and one-third (33%) said they would not deal with an organisation again. The full results are as follows:
- Complain to the organisation: 45%
- I wouldn’t use the organisation again: 33%
- Report it to an authority: 21%
- Seek legal advice: 8%
- Nothing: 5%
Figure 12: Awareness of privacy laws, by location
Figure 12 is a column chart broken down by location. Awareness was higher in capital city locations (46%) and lower in rural areas (35%). The full results are as follows:
| TOTAL | Capital city | Regional | Rural | |
|---|---|---|---|---|
| Aware of privacy laws | 43 | 46 | 42 | 35 |
| Not aware of privacy laws | 55 | 52 | 57 | 60 |
| Can’t say | 3 | 2 | 1 | 5 |
Figure 13: Who people would report a privacy breach to, by level of awareness and knowledge of privacy rights
Figure 13 is a bar chart showing that respondents’ most common answer was don’t know, followed by Ombudsman. The full results in descending order are as follows:
| TOTAL | Aware of privacy laws | Adequate or high level of knowledge of rights | |
|---|---|---|---|
| Don’t know | 24 | 15 | 9 |
| Ombudsman | 22 | 26 | 21 |
| Organisation involved | 17 | 19 | 24 |
| Consumer Affairs | 13 | 16 | 20 |
| Lawyers | 13 | 13 | 14 |
| MP | 11 | 14 | 11 |
| Police | 7 | 6 | 8 |
| Gov. Dept | 6 | 8 | 9 |
| Privacy Commissioner | 5 | 8 | 13 |
Figure 14: Attitude towards data matching, by age and income
Figure 14 is a column chart broken down by age group and income. Younger people and people with lower levels of education were less likely to support data-matching, while those with a household income of $60,000 or more were more likely to support data-matching. The full results are as follows:
| Response | 18-24 yrs | 25-39 yrs | 40-49 yrs | 50+ yrs |
|---|---|---|---|---|
| TOTAL AGREE | 64 | 74 | 80 | 76 |
| strongly agree | 21 | 24 | 22 | 27 |
| agree | 43 | 50 | 58 | 49 |
| disagree | 24 | 15 | 10 | 15 |
| strongly disagree | 1 | 2 | 3 | 2 |
| Response | under $30,000 | $30,000- $59,000 | $60,000+ |
|---|---|---|---|
| TOTAL AGREE | 80 | 76 | 83 |
| strongly agree | 25 | 32 | 30 |
| agree | 55 | 45 | 53 |
| disagree | 12 | 13 | 8 |
| strongly disagree | 4 | 2 | 1 |
Figure 17: The percentage of people who think permission should be sought before using unidentified health information for research purposes, by education and income
Figure 17 is a column chart broken down by education and income. While people on lower incomes and with lower levels of education were more likely to believe that permission should be sought before using unidentified health information, those on higher incomes and with higher education levels were less likely to see permission as necessary. The full results are as follows:
| Response | Year 10 or below | Year 11/12 or TAFE | Some uni/diploma | Degree |
|---|---|---|---|---|
| Permission should be sought | 67 | 66 | 49 | 54 |
| No need for permission | 26 | 29 | 45 | 42 |
| Response | Under $30,000 | $30,000- $59,000 | $60,000+ |
|---|---|---|---|
| Permission should be sought | 63 | 63 | 50 |
| No need for permission | 30 | 28 | 45 |
Figure 14: The percentage of people who believe that police should have access to databases containing personal information if it meant that twice as many crimes could be solved, by age
Figure 14 is a column chart broken down response then age group. It shows that younger people were more opposed to the idea of police accessing databases containing personal details of citizens. The full results are as follows:
| Response | TOTAL | 18-24 yrs | 25-39 yrs | 40-49 yrs | 50+ yrs |
|---|---|---|---|---|---|
| Yes | 55 | 54 | 57 | 51 | 56 |
| No | 28 | 34 | 26 | 27 | 29 |
| Maybe | 9 | 10 | 8 | 11 | 9 |
| Already have access | 3 | 2 | 4 | 6 | 2 |
| Can’t say | 4 | 1 | 5 | 5 | 4 |
Figure 16: The percentage of people who believe that police should have access to databases containing personal information if it meant that twice as many crimes could be solved, by education level
Figure 16 is a column chart broken down by response then education level. People with lower levels of education were more likely to support the idea, while those with the highest levels of education were most likely to oppose the idea. The full results are as follows:
| Response | TOTAL | Year 10 or lower | Year 11/12/or TAFE | Some uni/diploma | Degree |
|---|---|---|---|---|---|
| Yes | 55 | 62 | 62 | 54 | 42 |
| No | 28 | 26 | 22 | 29 | 38 |
| Maybe | 9 | 7 | 8 | 6 | 15 |
Figure 18: The percentage of people who regard the following scenarios/activities an invasion of privacy
Figure 18 is a column chart showing 5 scenarios and the percentage of respondents who considered it an invasion of privacy.
| Scenario | Yes, an invasion of privacy | Not an invasion of privacy |
|---|---|---|
| A business you don’t deal with obtains your details | 95 | 4 |
| Monitoring of internet activity without your knowledge | 90 | 7 |
| Using your details for a purpose other than that intended | 94 | 5 |
| Asking for details irrelevant to the transaction | 93 | 5 |
Figure 19: The percentage of people who agree or disagree with use of the electoral role or telephone directory for marketing purposes
Figure 19 is a column chart broken down by age group.
| Scenario | Agree | Disagree |
|---|---|---|
| Using the electoral role for marketing purposes | 22 | 60 |
| Using the White Pages telephone directory for marketing purposes | 42 | 46 |
Figure 20: The percentage of internet users who have more or fewer concerns about the security of their personal information when using the internet
Figure 20 is a column chart showing the responses of those who use the internet at least once a week (780 respondents). More than half had more concerns about the security of their personal information when using the internet. The full results are as follows:
- More concerns: 57%
- Fewer concerns: 8%
- About the same: 31%
- Can’t say: 4%
Figure 21: The effect of seeing a privacy policy on an internet site
Figure 21 is a bar chart broken down by response then gender. Twice as many women as men said seeing a privacy policy made them more confident about a site. The full results are as follows.
| Response | Men | Women | Total |
|---|---|---|---|
| Feel more positive | 13 | 26 | 18 |
| More cautious | 3 | 6 | 4 |
| More trustworthy | 2 | 5 | 3 |
| More respect | 2 | 4 | 3 |
| They are doing the right thing | 4 | 1 | 3 |
Where people would go to report a privacy breach, 1994 and 2001
This is a bar chart comparing results from 2001 and 1994. In 2001, there was an increase in answering Ombudsman while there was a decrease in answering Police. The full results are as follows.
| Who respondents would report to | 1994 results | 2001 results |
|---|---|---|
| Police | 17 | 7 |
| The organisation involved | 16 | 18 |
| Ombudsman | 14 | 24 |
| Solicitor | 11 | 13 |
| Consumer Affairs | 8 | 13 |
| MP | 7 | 13 |
| ATO | 3 | - |
| Privacy Commissioner | 2 | 5 |
| Can’t say | 26 | 24 |


