-
On this page
Executive summary
- 242 notifications
- 36% human error
- 59% malicious or criminal attacks
- 5% system faults
About this report
This report captures notifications received by the Office of the Australian Information Commissioner (OAIC) under the Notifiable Data Breaches (NDB) scheme between 1 April and 30 June 2018.
The OAIC publishes quarterly statistical information about notifications received under the NDB scheme, which commenced on 22 February 2018, to assist entities and the public to understand the operation of the scheme. The report uses the term ‘data breaches’ throughout to mean those data breaches received by the OAIC under the NDB scheme.
Where data breaches affect multiple entities, the OAIC may receive multiple notifications relating to the same data breach. Notifications to the OAIC relating to the same data breach incident are counted as a single notification in this report.
The source of any given data breach is based on information provided by the reporting entity. Where more than one source has been identified or is possible, the dominant or most likely source has been selected for statistical purposes. Sources of data breach categories are defined in the glossary at the end of this report.
Data breach notifications from all industry sectors
Number of data breaches reported — All sectors
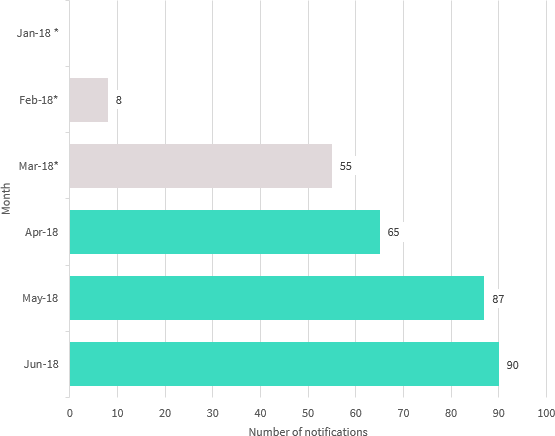
Chart 1.1 — Number of data breaches reported under the Notifiable Data Breaches scheme by month — All sectors
| Number of notifications | |
|---|---|
| Total received in the quarter — April to June 2018 | 242 |
| Total received January to March 2018* * As the NDB scheme commenced on 22 February 2018, data is only available for part of the quarter | 63 |
| Total received 2017-18 | 305 |
Number of individuals affected — All sectors
Chart 1.2 — Number of individuals affected by data breaches in the quarter — All sectors
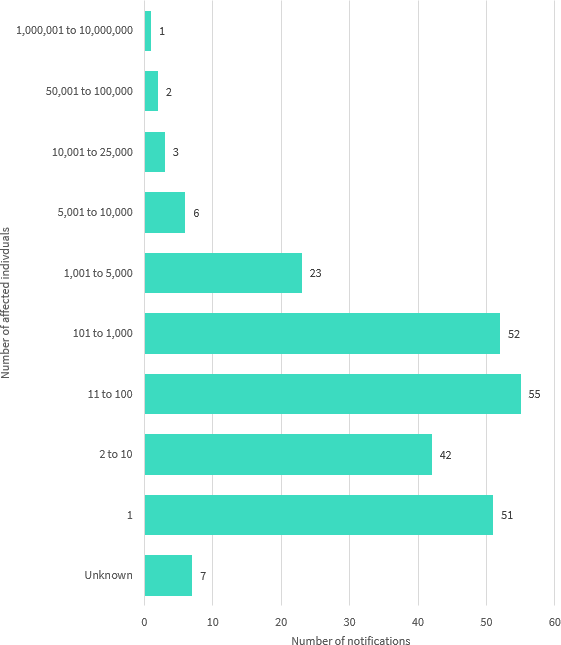
Note: Where bands are not shown (for example, 100,001 to 1,000,000), there were nil reports in the period. ‘Unknown’ includes notifications by entities whose investigations were ongoing at the time of this report.
Most data breaches in the period involved the personal information of 100 individuals or fewer (61 per cent of data breaches).
Data breaches impacting between 1 and 10 individuals comprised 38 per cent of the notifications.
Kinds of personal information involved in data breaches — All sectors
Chart 1.3 — Kinds of personal information involved in data breaches by number of notifications — All sectors
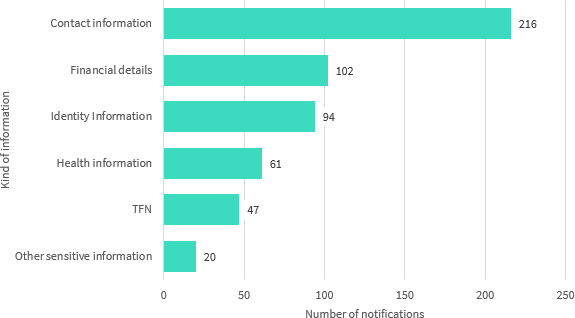
Note: Data breaches may involve one or more kinds of personal information.
| Kinds of personal information | % of data breaches |
|---|---|
| Contact information | 89% |
| Financial details | 42% |
| Identity information | 39% |
| Health information | 25% |
| TFN | 19% |
| Other sensitive information | 8% |
The majority of data breaches involved ‘contact information’, such as an individual’s home address, phone number or email address. This is distinct from ‘identity information’, which refers to information that is used to confirm an individual’s identity, such as passport number, driver’s licence number or other government identifiers.
Entities also notified data breaches that involved individuals’ tax file numbers (TFNs), financial details, such as bank account or credit card numbers, as well as health information. ‘Other sensitive information’ refers to categories of sensitive information as set out in section 6(1) of the Privacy Act 1988 (Privacy Act), other than health information as defined in section 6FA.
Source of the data breaches — All sectors
This chart breaks down the sources of data breaches as identified by notifying entities in all industry sectors in the quarter.
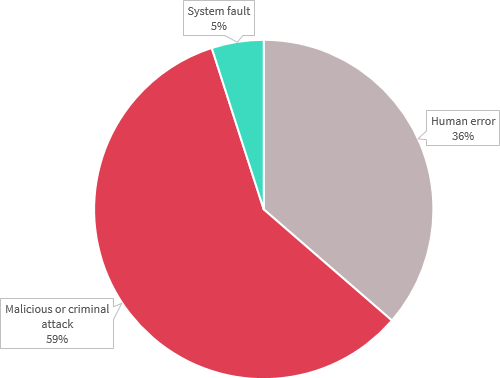
Malicious or criminal attacks accounted for 59 per cent of data breaches this quarter.
Malicious or criminal attacks differ from human error breaches in that they are deliberately crafted to exploit known vulnerabilities for financial or other gain. Attacks included cyber incidents such as phishing, malware, ransomware, brute-force attack, compromised or stolen credentials and hacking by other means, as well as social engineering or impersonation and actions taken by a rogue employee or insider threat. Theft of paperwork or storage devices was a significant source of malicious or criminal attacks.
Human error remained a major source of breaches, accounting for 36 per cent of data breaches. Further, many cyber incidents in this quarter appear to have exploited vulnerabilities involving a human factor (such as clicking on a phishing email or disclosing passwords).
System faults accounted for 5 per cent of data breaches.
Human error data breaches — All sectors
This chart breaks down the kinds of data breaches identified as ‘human error’ in the quarter.
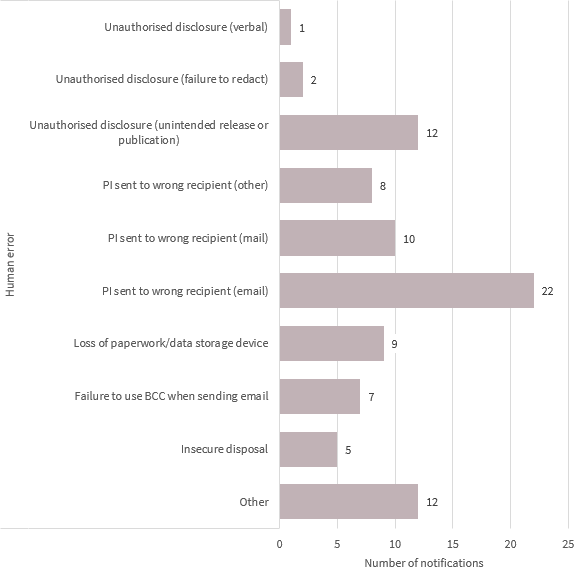
The second largest source of data breaches in the quarter was human error (36 per cent), with examples including sending personal information to the wrong recipient via email (22 notifications), mail (10 notifications) or in other ways (8 notifications), and unintended release or publication of personal information (12 notifications).
However, certain kinds of data breaches can affect larger numbers of people. For example, in this quarter human error data breaches involving the loss of storage devices impacted the largest numbers of people (an average of 1199 affected individuals per breach). Failures to use the ‘blind carbon copy’ (BCC) function when sending group emails impacted an average of 571 affected individuals per data breach. By contrast, human errors involving sending personal information to the wrong recipient generally impacted small groups or single individuals.
| Human error | No. of data breaches received | Average no. of affected individuals |
|---|---|---|
| Loss of paperwork/data storage device | 9 | 1199 |
| Failure to use BCC when sending email | 7 | 571 |
| Other | 12 | 440 |
| Unauthorised disclosure (unintended release or publication) | 12 | 216 |
| Insecure disposal | 5 | 69 |
| PI sent to wrong recipient (email) | 22 | 35 |
| PI sent to wrong recipient (mail) | 10 | 6 |
| PI sent to wrong recipient (other) | 8 | 1 |
Malicious or criminal attack data breaches — All sectors
This chart breaks down the kinds of data breaches identified as ‘malicious or criminal attack’ in the quarter.
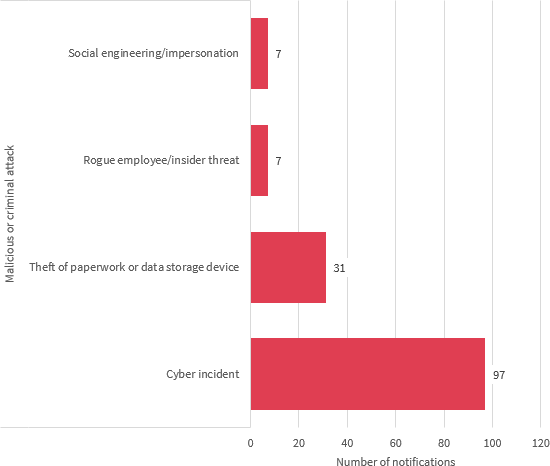
Malicious or criminal attacks were the largest source of data breaches this quarter, accounting for 59 per cent. Many cyber incidents in this quarter appear to have exploited vulnerabilities involving a human factor (such as clicking on a phishing email or disclosing passwords).
The largest source of attacks was cyber incidents (97 notifications) such as phishing, malware, ransomware, brute-force attack, compromised or stolen credentials and hacking by other means.
Theft of paperwork or storage devices was also a significant source of malicious or criminal attacks (31 notifications).
Other sources included social engineering or impersonation (7 notifications) and actions taken by a rogue employee or insider threat (7 notifications).
Cyber incident data breaches — All sectors
This chart breaks down the kinds of data breaches identified as ‘malicious or criminal attack — cyber incident’ in the quarter.
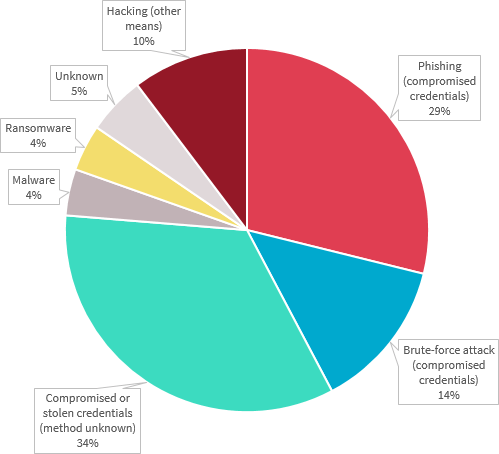
The majority of cyber incidents were linked to the compromise of credentials through phishing (29 per cent), brute-force attacks (14 per cent) or by unknown methods (34 per cent).
System fault data breaches — All sectors
This chart breaks down the kinds of data breaches identified as ‘system fault’ in the quarter.
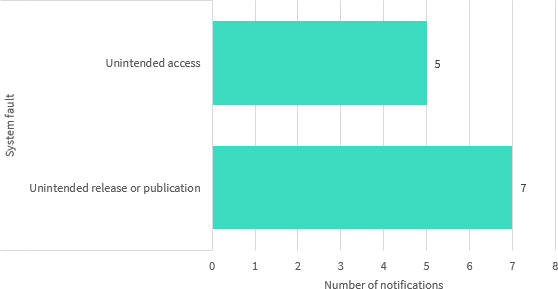
System faults accounted for 5 per cent of data breaches this quarter.
Five data breaches related to unintended access to personal information as a result of a system fault, and seven related to unintended release or publication of personal information as a result of a system fault.
Comparison of top 5 industry sectors that reported data breaches in the quarter
This section compares notifications reported under the Notifiable Data Breaches (NDB) scheme by the five industry sectors that made the most notifications in the quarter (the top 5 industry sectors).
Top 5 industry sectors
| Top 5 industry sectors | Number of data breaches received |
|---|---|
| Health service providers[1] | 49 |
| Finance[2] | 36 |
| Legal, Accounting & Management services | 20 |
| Education[3] | 19 |
| Business and Professional Associations | 15 |
The NDB scheme applies to agencies and organisations that the Privacy Act requires to take reasonable steps to secure personal information. This includes most Australian Government agencies, businesses and not-for-profit organisations with an annual turnover of $3 million or more, credit reporting bodies, private health service providers, and TFN recipients, among others.
During April to June 2018, the largest source of reported data breaches was the private health service provider sector (health sector) (20 per cent). The second largest source was the finance sector (15 per cent). This was followed by the legal, accounting and management services sector (8 per cent), the private education sector (8 per cent), and the business and professional associations sector (6 per cent).
Notifications made under the My Health Records Act 2012 are not included in this report, as they are subject to specific notification requirements set out in that Act.
Source of the data breaches — Top 5 industry sectors
This chart breaks down the sources of data breaches as identified by notifying entities in the top 5 industry sectors in the quarter.
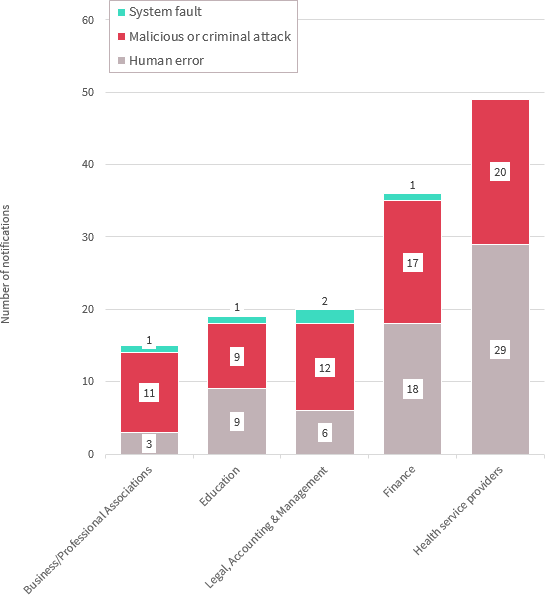
The highest reporting sector was the health service providers sector (49 notifications). Of those notifications, 59 per cent of reportable data breaches resulted from human error (29 notifications). Notifications from the finance sector also indicated that 50 per cent of its data breaches resulted from human error (36 notifications).
Legal, accounting and management and business and professional associations notified the majority of breaches resulting from malicious or criminal attacks.
Four of the top 5 sectors notified at least one breach resulting from a system fault.
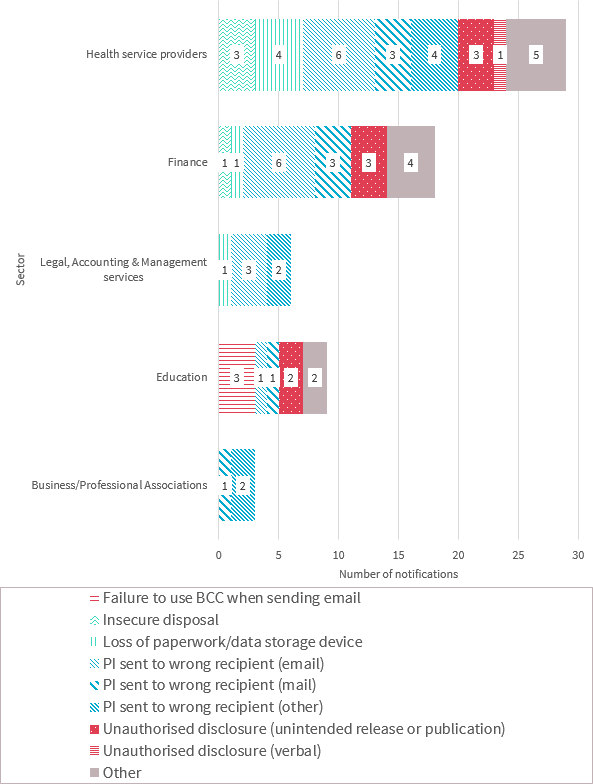
Human error data breaches — Top 5 industry sectors
This chart breaks down the kinds of data breaches identified as ‘human error’ by the top 5 industry sectors in the quarter.
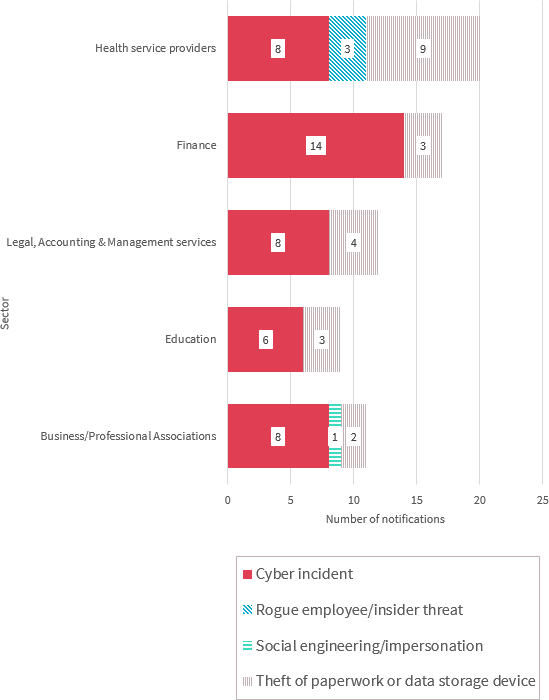
Malicious or criminal attack data breaches — Top 5 industry sectors
This chart breaks down the kinds of data breaches identified as ‘malicious or criminal attack’ by the top 5 industry sectors in the quarter.
Chart 2.3 — Malicious or criminal attacks breakdown — Top 5 industry sectors
Cyber incident data breaches — Top 5 industry sectors
This chart breaks down the kinds of data breaches identified as ‘malicious or criminal attack — cyber incident’ by the top 5 industry sectors in the quarter.
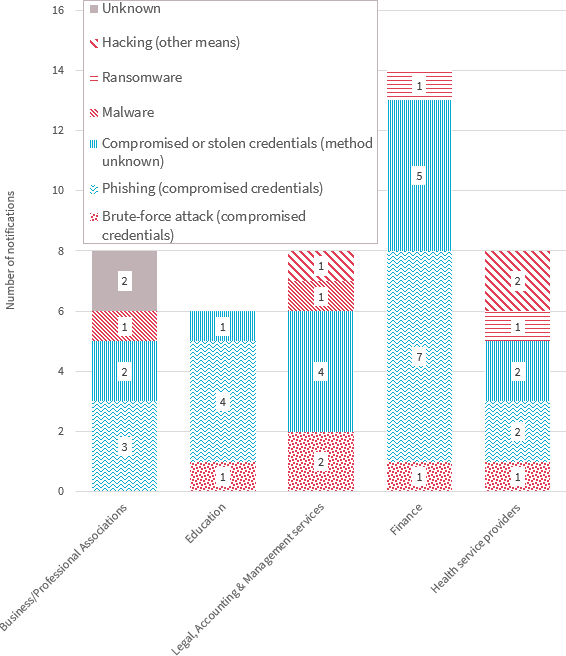
Similar to the overall trend, a majority of cyber incidents in the top 5 reporting sectors were linked to the compromise of credentials through phishing, brute-force attacks, or by unknown methods, particularly in the finance sector where these kinds of attacks accounted for 93 per cent of all cyber incident data breaches.
System fault data breaches — Top 5 industry sectors
This chart breaks down the kinds of data breaches identified as ‘system fault’ by the top 5 industry sectors in the quarter.
Finance sector report
This section covers notifications made under the Notifiable Data Breaches scheme by entities in the finance sector, such as banks, wealth managers, financial advisors, and superannuation funds.
Summary — Finance sector
- 36 notifications
- 50% human error
- 47% malicious or criminal attacks
- 3% system faults
Number of data breaches reported — Finance sector
| Number of notifications | |
|---|---|
| Total received in the quarter — April to June 2018 | 36 |
| Total received January to March 2018* * As the NDB scheme commenced on 22 February 2018, data is only available for part of the quarter | 8 |
| Total received 2017-18 | 44 |
Number of individuals affected — Finance sector
Chart 3.1 — Number of individuals affected by data breaches in the quarter — Finance sector
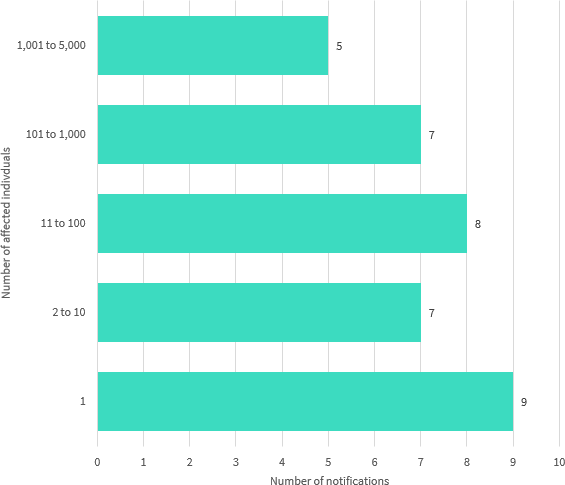
Note: Where bands are not shown, there were nil reports in the period.
Most notifications in the period from the finance sector involved the personal information of 100 individuals or fewer (67 per cent of breaches). Breaches impacting between 1 and 10 individuals comprised 44 per cent of the notifications. 33 per cent of notifications included affected more than 100 individuals.
Source of the data breaches — Finance sector
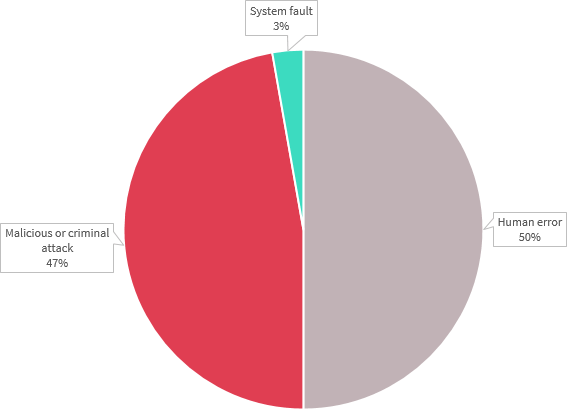
Human error accounted for 50 per cent of data breaches reported from the finance sector.
Malicious or criminal attacks accounted for 47 per cent of data breaches.
Human error data breaches — Finance sector
This chart breaks down the kinds of data breaches identified as ‘human error’ by the finance sector in the quarter.
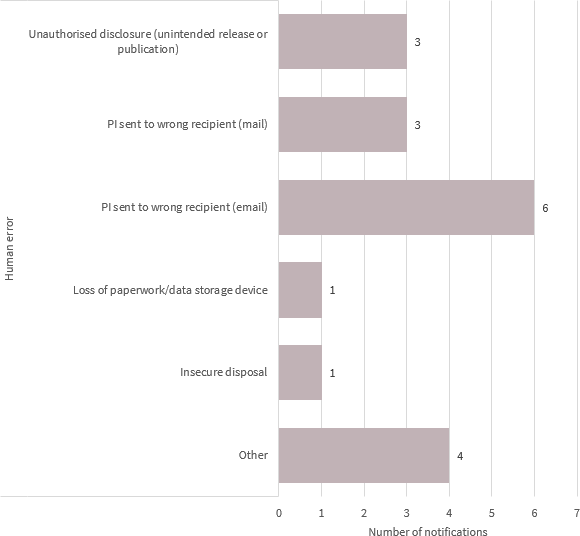
The largest source of data breaches from the finance sector was human error (50 per cent), with examples including sending personal information to the wrong recipient by email (6 notifications) or mail (3 notifications), and unintended release or publication of personal information (3 notifications).
Malicious or criminal attack data breaches — Finance sector
This chart breaks down the kinds of data breaches identified as ‘malicious or criminal attack’ by the finance sector in the quarter.
Chart 3.4 — Malicious or criminal attacks breakdown — Finance sector
Malicious and criminal attacks were the second largest source of data breaches notified by the finance sector (47 per cent). Of these, cyber incidents were the most common type of attack (14 notifications).
Cyber incident data breaches — Finance sector
This chart breaks down the kinds of data breaches identified as ‘malicious or criminal attack — cyber incident’ by the finance sector in the quarter.
Of the cyber incidents notified by the finance sector, 93 per cent of incidents were related to lost or stolen credentials (such as phishing or brute-force attacks). Ransomware attacks comprised the remaining 7 per cent.
System fault data breaches — Finance sector
One notification in the quarter identified the source of the data breach as a system fault leading to unauthorised access.
Health sector report
This section covers notifications made under the Notifiable Data Breaches scheme by entities in the private health service provider (health) sector.[4]
Notifications made under the My Health Records Act 2012 are not included in this report, as they are subject to specific notification requirements set out in that Act.
Summary — Health sector
- 49 notifications
- 59% human error
- 41% malicious or criminal attacks
- 0% system faults
Number of data breaches reported — Health sector
| Number of notifications | |
|---|---|
| Total received in the quarter — April to June 2018 | 49 |
| Total received January to March 2018* * As the NDB scheme commenced on 22 February 2018, data is only available for part of the quarter | 15 |
| Total received 2017-18 | 64 |
Number of individuals affected — Health sector
Chart 4.1 — Number of individuals affected by breaches in the quarter — Health sector
Note: Where bands are not shown, there were nil reports in the period.
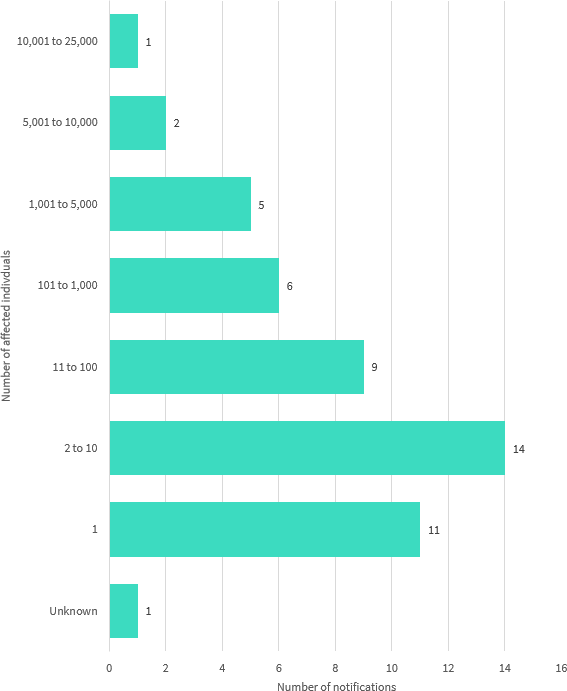
Most notifications in the period from the health sector involved the personal information involving 100 individuals or fewer (69 per cent of breaches). Data breaches impacting between 1 and 10 individuals comprised 51 per cent of the notifications. 29 per cent of data breaches affected more than 100 individuals.
Source of the data breaches — Health sector
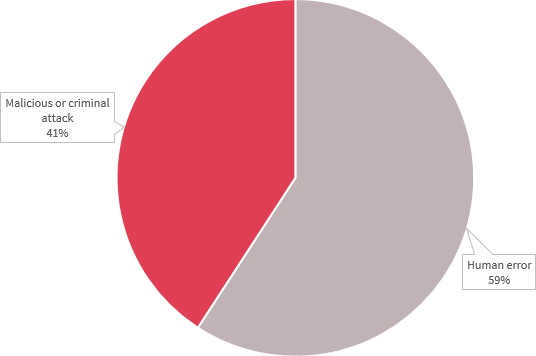
Human error accounted for 59 per cent of data breaches in the health sector. This encompasses incidents in which a mistake made by a person caused the data breach, such as communications sent to the wrong recipient, insecure disposal of personal information, or loss of paperwork or a storage device.
Malicious or criminal attacks accounted for 41 per cent of health sector data breaches.
Human error data breaches — Health sector
This chart breaks down the kinds of data breaches identified as ‘human error’ by the health sector in the quarter.
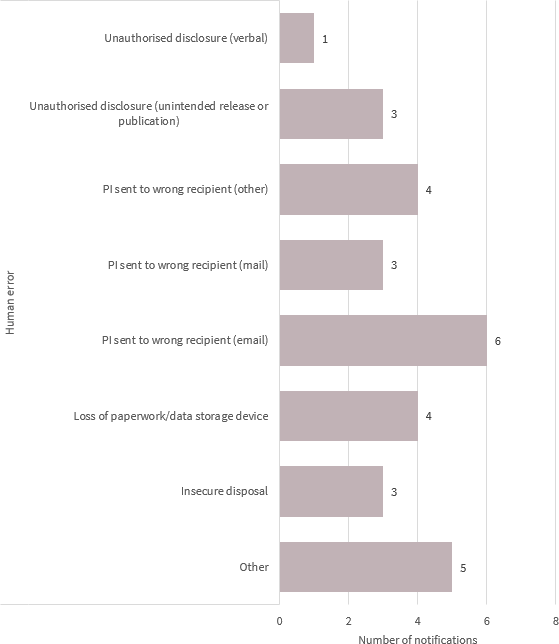
The largest source of data breaches from the health sector was human error (59 per cent), with examples including sending personal information to the wrong recipient by email (6 notifications), mail (3 notifications) or other means (4 notifications), loss of paperwork or storage devices (4 notifications) and unintended release or publication of personal information (3 notifications).
Malicious or criminal attack data breaches — Health sector
This chart breaks down the kinds of data breaches identified as ‘malicious or criminal attack’ by the health sector in the quarter.
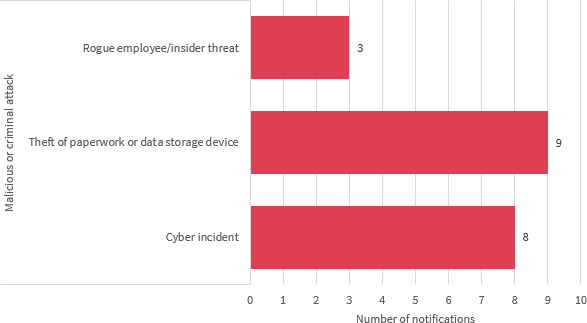
Malicious and criminal attacks were the second largest source of data breaches from the health sector (41 per cent). Theft of paperwork or storage devices was the most common type of attack (9 notifications). Cyber incidents were second most common type of attack (8 notifications).
Cyber incident data breaches — Health sector
This chart breaks down the kinds of data breaches identified as ‘malicious or criminal attack — cyber incident’ by the health sector in the quarter.
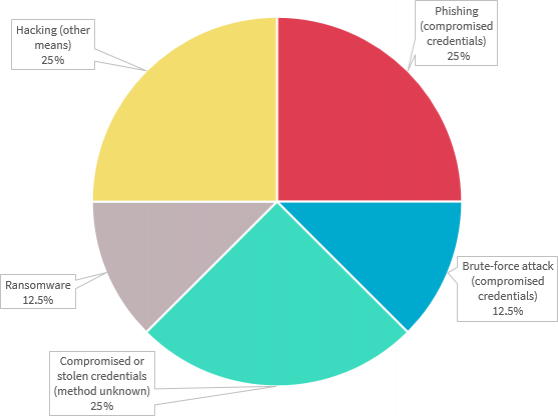
Of the cyber incident data breaches notified by the health sector, 62.5 per cent of incidents related to lost or stolen credentials (such as phishing or brute-force attacks). Hacking by other means (25 per cent) and ransomware attacks (12.5 per cent) comprised the remaining cyber incidents.
System fault data breaches — Health sector
In the quarter, ‘system faults’ was not identified as the source of any data breaches notified by the health sector.
Glossary
Data breach categories
| Term | Definition |
|---|---|
| Human error | An unintended action by an individual directly resulting in a data breach, for example inadvertent disclosure caused by sending a document containing personal information to the incorrect recipient. |
| PI sent to wrong recipient (email) | Personal information sent to the wrong recipient via email, for example, as a result of misaddressed email or incorrect address on file. |
| PI sent to wrong recipient (fax) | Personal information sent to the wrong recipient via facsimile machine, for example, as a result of fax number incorrectly entered or wrong fax number on file. |
| PI sent to wrong recipient (mail) | Personal information sent to the wrong recipient via postal mail, for example, as a result of transcribing error or wrong address on file. |
| PI sent to wrong recipient (other) | Personal information sent to the wrong recipient via channels other than email, fax or mail, for example, delivery by hand or uploading to web portal. |
| Failure to use BCC when sending email | Sending an email to a group by including all recipient emails addresses in the ‘To’ field, thereby disclosing all recipient email addresses to all recipients. |
| Insecure disposal | Disposing of personal information in a manner that could lead to its unauthorised disclosure, for example, using a public rubbish bin to dispose of customer records instead of a secure document disposal bin. |
| Loss of paperwork/data storage device | Loss of a physical asset(s) containing personal information, for example, leaving a folder or a laptop on a bus. |
| Unauthorised disclosure (failure to redact) | Failure to effectively remove or de-identify personal information from a record before disclosing it. |
| Unauthorised disclosure (verbal) | Disclosing personal information without authorisation, verbally, for example, calling it out in a waiting room. |
| Unauthorised disclosure (unintended release or publication) | Unauthorised disclosure of personal information in a written format, including paper documents or online. |
| Malicious or criminal attack | A malicious or criminal attack deliberately crafted to exploit known vulnerabilities for financial or other gain. |
| Theft of paperwork or data storage device | Theft of paperwork or data storage device. |
| Social engineering/impersonation | An attack that relies heavily on human interaction to manipulate people into breaking normal security procedures and best practices in order to gain access to systems, networks or physical locations. |
| Rogue employee/insider threat | An attack by an employee or insider acting against the interests of their employer or other entity. |
| Cyber incident | A cyber incident targets computer information systems, infrastructures, computer networks, or personal computer devices. |
| Malware | Software which is specifically designed to disrupt, damage, or gain unauthorised access to a computer system. |
| Ransomware | A type of malicious software designed to block access to data or a computer system until a sum of money is paid or other conditions are met. |
| Phishing (compromised credentials) | An attack in which the target is contacted by email or text message by someone posing as a legitimate institution to lure individuals into providing personal information, sensitive information or passwords. |
| Brute-force attack (compromised credentials) | Automated software is used to generate a large number of consecutive guesses as to the value of the desired data, for example passwords. |
| Compromised or stolen credentials (method unknown) | Credentials are compromised or stolen by methods unknown. |
| Hacking (other means) | Exploiting a software or security weakness to gain access to a system or network, other than by way of phishing, brute-force attack or malware. |
| System fault | A business or technology process error not caused by direct human error. |
Other terminology used in this report and in the NDB Form[5]
| Term | Definition/examples |
|---|---|
| Financial details | Information relating to an individual’s finances, for example, bank account or credit card numbers. |
| Tax File Number (TFN) | An individual’s personal reference number in the tax and superannuation systems, issued by the Australian Taxation Office. |
| Identity information | Information that is used to confirm an individual’s identity, such as a passport number, driver’s licence number or other government identifier. |
| Contact information | Information that is used to contact an individual, for example, home address, phone number or email address. |
| Health information | As defined in section 6FA of the Privacy Act. |
| Other sensitive information | Sensitive information, other than health information, as defined in section 6(1) of the Privacy Act. For example, sexual orientation, political or religious views. |
Long text descriptions
Chart 1.1 — Number of data breaches reported under the Notifiable Data Breaches scheme by month — All sectors
Chart 1.1 is a bar chart showing the number of data breaches reported under the Notifiable Data Breaches scheme by month, from January 2018 to June 2018.
As the NDB scheme commenced on 22 February 2018, data is only available for part of the quarter of January to March 2018.
| Month of 2018 | Number of notifications |
|---|---|
| January | 0 |
| February | 8 |
| March | 55 |
| April | 65 |
| May | 87 |
| June | 90 |
Chart 1.2 — Number of individuals affected by data breaches in the quarter — All sectors
Chart 1.2 is a bar chart showing the number of affected individuals. Where bands are not shown (for example, 100,001 to 1,000,000), there were nil reports in the period. ‘Unknown’ includes notifications by entities whose investigations were ongoing at the time of this report.
| Number of affected individuals | Number of notifications |
|---|---|
| 1,000,001 to 10,000,000 | 1 |
| 50,001 to 100,000 | 2 |
| 10,001 to 25,000 | 3 |
| 5,001 to 10,000 | 6 |
| 1,001 to 5,000 | 23 |
| 101 to 1,000 | 52 |
| 11 to 100 | 55 |
| 2 to 10 | 42 |
| 1 | 51 |
| Unknown | 7 |
Chart 1.3 — Kinds of personal information involved in data breaches by number of notifications — All sectors
Chart 1.3 is a bar chart showing the kind of personal information involved in data breaches by number of notifications. From most to least notifications:
| Kind of personal information involved | Number of notifications |
|---|---|
| Contact information | 216 |
| Financial details | 102 |
| Identity Information | 94 |
| Health information | 61 |
| TFN | 47 |
| Other sensitive information | 20 |
Chart 1.4 — Source of data breaches by percentage — All sectors
Chart 1.4 is a pie chart showing the sources of data breaches by percentage. From most to least, they are:
- Malicious or criminal attack: 59%
- Human error: 36%
- System fault: 5%
Chart 1.5 — Human error breakdown — All sectors
Chart 1.5 is a bar chart that breaks down the kinds of data breaches identified as ‘human error’ in the quarter by number of notifications.
| Human error type | Number of notifications |
|---|---|
| Unauthorised disclosure (verbal) | 1 |
| Unauthorised disclosure (failure to redact) | 2 |
| Unauthorised disclosure (unintended release or publication) | 12 |
| Personal information sent to wrong recipient (other) | 8 |
| Personal information sent to wrong recipient (mail) | 10 |
| Personal information sent to wrong recipient (email) | 22 |
| Loss of paperwork/data storage device | 9 |
| Failure to use BCC when sending email | 7 |
| Insecure disposal | 5 |
| Other | 12 |
Chart 1.6 — Malicious or criminal attack breakdown — All sectors
Chart 1.6 is a bar chart that breaks down the kinds of data breaches identified as ‘malicious or criminal attack’ in the quarter by number of notifications. From least to most notifications:
| Malicious or criminal attack | Number of notifications |
|---|---|
| Social engineering/impersonation | 7 |
| Rogue employee/insider threat | 7 |
| Theft of paperwork or data storage device | 31 |
| Cyber incident | 97 |
Chart 1.7 — Cyber incident breakdown — All sectors
Chart 1.7 is a pie chart that breaks down the kinds of data breaches identified as ‘malicious or criminal attack — cyber incident’ in the quarter by percentage. In order displayed:
| Malicious or criminal attack | Percentage |
|---|---|
| Phishing (compromised credentials) | 29% |
| Brute-force attack (compromised credentials) | 14% |
| Compromised or stolen credentials (method unknown) | 34% |
| Malware | 4% |
| Ransomware | 4% |
| Unknown | 5% |
| Hacking (other means) | 10% |
Chart 1.8 — System fault breakdown — All sectors
Chart 1.8 is a bar chart that breaks down the kinds of data breaches identified as ‘system fault’ in the quarter by number of notifications. They are:
- Unintended access: 5 notifications
- Unintended release or publication: 7 notifications
Chart 2.1 — Source of data breaches — Top 5 industry sectors
Chart 2.1 is a bar chart that breaks down the sources of data breaches as identified by notifying entities in the top 5 industry sectors in the quarter, by number of notifications. From least to most total notifications:
| Industry sector | Human error | Malicious or criminal attack | System fault |
|---|---|---|---|
| Business/Professional Associations | 3 | 11 | 1 |
| Education | 9 | 9 | 1 |
| Legal, Accounting & Management | 6 | 12 | 2 |
| Finance | 18 | 17 | 1 |
| Health service providers | 29 | 20 | 0 |
Chart 2.2 — Human error breakdown — Top 5 industry sectors
Chart 2.2 is a bar chart that breaks down the kinds of data breaches identified as ‘human error’ by the top 5 industry sectors in the quarter, by number of notifications. From least to most total notifications:
| Industry sector | Failure to use BCC when sending email | Insecure disposal | Loss of paperwork/data storage device | Personal information sent to wrong recipient (email) | Personal information sent to wrong recipient (mail) | Personal information sent to wrong recipient (other) | Unauthorised disclosure (unintended release or publication) | Unauthorised disclosure (verbal) | Other |
|---|---|---|---|---|---|---|---|---|---|
| Business/Professional Associations | 0 | 0 | 0 | 0 | 1 | 2 | 0 | 0 | 0 |
| Legal, Accounting & Management services | 0 | 0 | 1 | 3 | 0 | 2 | 0 | 0 | 0 |
| Education | 3 | 0 | 0 | 1 | 1 | 0 | 2 | 0 | 2 |
| Finance | 0 | 1 | 1 | 6 | 3 | 0 | 3 | 0 | 4 |
| Health service providers | 0 | 3 | 4 | 6 | 3 | 4 | 3 | 1 | 5 |
Chart 2.3 — Malicious or criminal attacks breakdown — Top 5 industry sectors
Chart 2.3 is a bar chart that breaks down the kinds of data breaches identified as ‘malicious or criminal attack’ by the top 5 industry sectors in the quarter. From least to most total notifications:
| Industry sector | Cyber incident | Rogue employee/insider threat | Social engineering/impersonation | Theft of paperwork or data storage device |
|---|---|---|---|---|
| Education | 6 | 0 | 0 | 3 |
| Business/Professional Associations | 8 | 0 | 1 | 2 |
| Legal, Accounting & Management services | 8 | 0 | 0 | 4 |
| Finance | 14 | 0 | 0 | 3 |
| Health service providers | 8 | 3 | 0 | 9 |
Chart 2.4 — Cyber incident breakdown — Top 5 industry sectors
Chart 2.4 is a bar chart that breaks down the kinds of data breaches identified as ‘malicious or criminal attack — cyber incident’ by the top 5 industry sectors in the quarter. From least to most total notifications:
| Industry sector | Brute-force attack (compromised credentials) | Phishing (compromised credentials) | Compromised or stolen credentials (method unknown) | Malware | Ransomware | Hacking (other means) | Unknown |
|---|---|---|---|---|---|---|---|
| Education | 1 | 4 | 1 | 0 | 0 | 0 | 0 |
| Business/Professional Associations | 0 | 3 | 2 | 1 | 0 | 0 | 2 |
| Legal, Accounting & Management services | 2 | 0 | 4 | 1 | 0 | 1 | 0 |
| Health service providers | 1 | 2 | 2 | 0 | 1 | 2 | 0 |
| Finance | 1 | 7 | 5 | 0 | 1 | 0 | 0 |
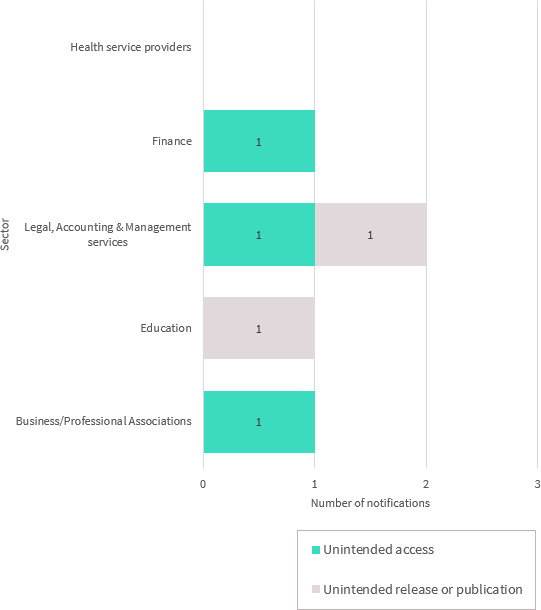
Chart 2.5 — System fault breakdown — Top 5 industry sectors
Chart 2.5 is a bar chart that breaks down the kinds of data breaches identified as ‘system fault’ by the top 5 industry sectors in the quarter.
| Industry sector | Unintended access | Unintended release or publication |
|---|---|---|
| Business/Professional Associations | 1 | 0 |
| Education | 0 | 1 |
| Legal, Accounting & Management services | 1 | 1 |
| Finance | 1 | 0 |
| Health service providers | 0 | 0 |
Chart 3.1 — Number of individuals affected by data breaches in the quarter — Finance sector
Chart 3.1 is a bar chart that shows the number of individuals affected by data breaches in the quarter in the Finance sector, by number of notifications. Where bands are not shown, there were nil reports in the period.
| Number of affected individuals | Number of notifications |
|---|---|
| 1,001 to 5,000 | 5 |
| 101 to 1,000 | 7 |
| 11 to 100 | 8 |
| 2 to 10 | 7 |
| 1 | 9 |
Chart 3.2 — Source of data breaches by percentage — Finance sector
Chart 3.2 is a pie chart showing the source of data breaches by percentage in the Finance sector. From most to least, they are:
- Human error: 50%
- Malicious or criminal attack: 47%
- System fault: 3%
Chart 3.3 — Human error breakdown — Finance sector
Chart 3.3 is a bar chart that breaks down the kinds of data breaches identified as ‘human error’ in the Finance sector in the quarter, by number of notifications. From most to least notifications:
| Human error | Number of notifications |
|---|---|
| PI sent to wrong recipient (email) | 6 |
| Other | 4 |
| PI sent to wrong recipient (mail) | 3 |
| Unauthorised disclosure (unintended release or publication) | 3 |
| Insecure disposal | 1 |
| Loss of paperwork/data storage device | 1 |
Chart 3.4 — Malicious or criminal attacks breakdown — Finance sector
Chart 3.4 is a bar chart that breaks down the kinds of data breaches identified as ‘malicious or criminal attack’ by the finance sector in the quarter. There were 14 notifications of cyber incidents and 3 notifications of theft of paperwork or data storage device.
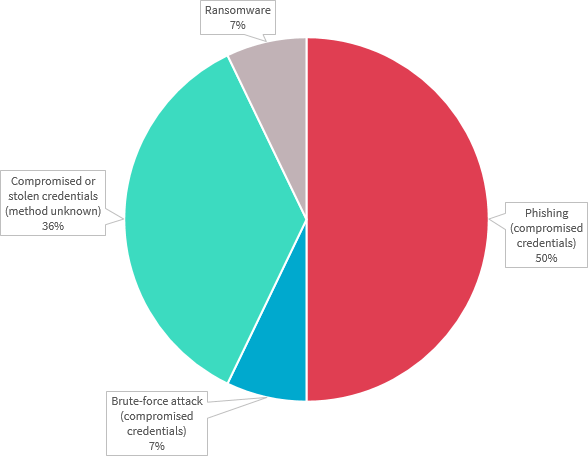
Chart 3.5 — Cyber incident breakdown — Finance sector
Chart 3.5 is a pie chart that breaks down the kinds of data breaches identified as ‘malicious or criminal attack — cyber incident’ by the finance sector in the quarter. From most to least notifications:
- Phishing (compromised credentials): 50%
- Compromised or stolen credentials (method unknown): 36%
- Compromised or stolen credentials (method unknown): 7%
- Ransomware: 7%
Chart 4.1 — Number of individuals affected by breaches in the quarter — Health sector
Chart 4.1 is a bar chart that shows the number of individuals affected by breaches in the health sector, by number of notifications. Where bands are not shown, there were nil reports in the period.
| Number of affected individuals | Number of notifications |
|---|---|
| 10,001 to 25,000 | 1 |
| 5,001 to 10,000 | 2 |
| 1,001 to 5,000 | 5 |
| 101 to 1,000 | 6 |
| 11 to 100 | 9 |
| 2 to 10 | 14 |
| 1 | 11 |
| Unknown | 1 |
Chart 4.2 — Source of data breaches by percentage — Health sector
Chart 4.2 is a pie chart that shows the source of data breaches in the health sector. Human error accounted for 59% while malicious or criminal attacks accounted for 41%.
Chart 4.3 — Human error breakdown — Health sector
Chart 4.3 is a bar chart that breaks down the kinds of data breaches identified as ‘human error’ by the health sector in the quarter.
| Human error type | Number of notifications |
|---|---|
| Unauthorised disclosure (verbal) | 1 |
| Unauthorised disclosure (unintended release or publication) | 3 |
| PI sent to wrong recipient (other) | 4 |
| PI sent to wrong recipient (mail) | 3 |
| PI sent to wrong recipient (email) | 6 |
| Loss of paperwork/data storage device | 4 |
| Insecure disposal | 3 |
| Other | 5 |
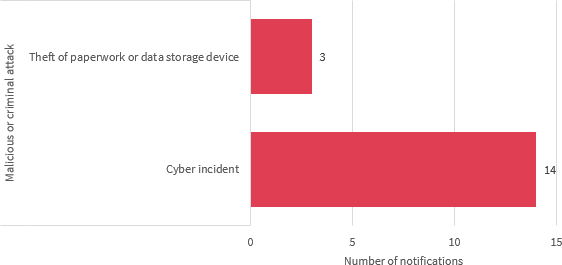
Chart 4.4 — Malicious or criminal attacks breakdown — Health sector
Chart 4.4 is a bar chart that breaks down the kinds of data breaches identified as ‘malicious or criminal attack’ by the health sector in the quarter. From most to least notifications:
- Theft of paperwork or data storage device: 9
- Cyber incidents: 8
- Rogue employee/insider threat: 3
Chart 4.5 — Cyber incident breakdown — Health sector
Chart 4.5 is a pie chart that breaks down the kinds of data breaches identified as ‘malicious or criminal attack — cyber incident’ by the health sector in the quarter.
Footnotes
[1] A health service provider generally includes any private sector entity that provides a health service within the meaning of s 6FB of the Privacy Act. State or Territory public hospitals and health services are generally not covered — they are bound by State and Territory privacy laws, as applicable.
[2] This sector includes banks, wealth managers, financial advisors, and superannuation funds.
[3] This sector includes private education providers who are APP entities and the Australian National University. Other public sector education providers are bound by State and Territory privacy laws, as applicable.
[4] A health service provider generally includes any private sector entity that provides a health service within the meaning of s 6FB of the Privacy Act. State or Territory public hospitals and health services are generally not covered — they are bound by State and Territory privacy laws, as applicable.
[5] OAIC’s Notifiable Data Breach Form.


