-
On this page
 Download the print version
Preliminary pages
Report prepared by![]()
The Office of the Australian Information Commissioner (OAIC) was established on 1 November 2010 by the Australian Information Commissioner Act 2010.
![]()
Creative Commons
With the exception of the Commonwealth Coat of Arms this report Australian Community Attitudes to Privacy Survey 2017 is licensed under a Creative Commons Attribution 3.0 Australia licence (http://creativecommons.org/licenses/by/3.0/au/deed.en)
Document Retrieval Information:
Publication date: May 2017
No of Pages: 51
ISBN: ISBN 978-1-877079-92-4
Publication Title: Australian Community Attitudes to Privacy Survey 2017
Authors: Ms Jayne Van Souwe, Mr Patrick Gates, Mr Ben Bishop, Ms Claire Dunning
Organisation that prepared this report:
Wallis Market and Social Research (Wallis Consulting Group P/L)
118 Balmain Street
CREMORNE VIC 3121
All OAIC publications can be made available in a range of accessible formats for people with disabilities. If you require assistance please contact the OAIC.
Report available from:
Office of the Australian Information Commissioner
GPO Box 5218
SYDNEY NSW 2001
Phone: 1300 363 992
List of tables
- Table 1. Information Australians are reluctant to provide to businesses and government
- Table 2. Measures taken by Australians to protect their personal information — by demographics
- Table 3. Impact of seeing or reading privacy policies on attitudes towards the site
- Table 4. Sample composition
List of figures
- Figure 1. Awareness of the Privacy Commissioner by gender and age
- Figure 2. Understanding of entities covered by the Privacy Act
- Figure 3. Biggest privacy risks facing people today
- Figure 4. Information Australians are most reluctant to provide to businesses and government
- Figure 5. Reasons for reluctance to give key piece of information
- Figure 6. Australians’ trust in organisations
- Figure 7. Reaction to unsolicited marketing activity
- Figure 8. Feelings about personal information being sent overseas
- Figure 9. Australians’ comfort with businesses sharing personal information with other organisations
- Figure 10. Australians’ comfort with government agencies sharing personal information
- Figure 11. Australians’ comfort with government using their information for research
- Figure 12. Organisations people would report misuse of personal information to
- Figure 13. What is a misuse of information?
- Figure 14. Awareness of the ability to access personal information from government and business
- Figure 15. Awareness of the ability to access personal information from government and business — by highest level of education
- Figure 16. Support for being informed about loss of personal information
- Figure 17. Measures taken by Australians to protect their personal information
- Figure 18. Proportion of Australians who have decided not to deal with an organisation because of concerns over the use of personal information
- Figure 19. Australians’ willingness to give personal information in exchange for a benefit
- Figure 20. Concern with using biometric data in a number of day-to-day situations
- Figure 21. Change in levels of concern with the privacy of personal information online compared to five years ago — year on year
- Figure 22. Change in levels of concern with the privacy of personal information online compared to five years ago — by age
- Figure 23. How often products are purchased online
- Figure 24. How often products are purchased online by age
- Figure 25. How often products are purchased online by income
- Figure 26. Perceived risk to privacy dealing with organisations online versus traditional methods
- Figure 27. Perceptions of the proportion of websites that collect information about the people who use them
- Figure 28. Proportion of apps that collect information about the people who use them
- Figure 29. Level of comfort with search engines and social media sites targeting advertising based on online behaviour
- Figure 30. Level of comfort with search engines and social media sites targeting advertising based on online behaviour — gender by age
- Figure 31. Level of comfort with search engines and social networking keeping databases of online activity
- Figure 32. Perception of social networking as a public versus private activity
- Figure 33. Regret relating to material posted on a social networking site
- Figure 34. Reading privacy policies
- Figure 35. Proportion of Australians who have been or know someone who has been the victim of ID fraud and theft
- Figure 36. Proportion of Australians concerned they may become victim of ID fraud and theft in the next 12 months
- Figure 37. Awareness of credit ratings
- Figure 38. Getting information about credit ratings
Commissioner’s foreword
 Thank you for taking the time to explore the findings of the 2017 Australian Community Attitudes to Privacy Survey (ACAPS).
The ACAPS is the longest-standing and most in-depth study of how Australian attitudes to privacy have evolved, having been conducted in various forms since 1990. With the extension of the Privacy Act 1988 to cover the private sector, the survey was broadened to its current scope in 2001.
In the 16 years since then, the technological, social and consumer landscape in which our personal information is used has changed dramatically. For example, in 2001 Facebook did not exist, nor did the iPhone, and biometric identity systems like touch ID were the stuff of spy fantasy.
So it’s perhaps not surprising that the latest survey shows that Australians are increasingly concerned about the privacy risks that have evolved in tandem with new technology and new ways of connecting socially.
Sixty-nine per cent of Australians say they are more concerned about their online privacy than they were five years ago. And it seems that Australians continue to experience the privacy risks that may travel with new technology; with around one-in-four regretting social media activity and a similar percentage knowing a victim of identity theft.
As Commissioner, the striking message in the 2017 survey is that while privacy is attracting concern from Australian consumers and communities, many of us are not converting that concern into using basic privacy protections that are already available to us.
For example, the survey shows the majority of us do not regularly read the privacy policies of websites we use; and that 43 per cent of us do not regularly adjust the privacy settings on our social media accounts. Around a quarter of us have rarely or never asked an organisation why they need our personal information — even though this is a basic privacy right. And 58 per cent of us don’t know that we can request access to the personal information a business or government agency holds about us.
So, while it’s encouraging to see Australians taking privacy seriously, it’s important for individuals to use this concern to take active steps to protect their personal information. This includes knowing our privacy rights and protections, and insisting that the organisations we deal with take those protections seriously.
I also encourage all Australian businesses and agencies to understand what the 2017 ACAPS report tells us about the expectations of Australian communities — and to strive to meet those expectations with a privacy-by-design approach to product, policy and service development.
My office will be exploring the ACAPS 2017 findings in depth, to inform our priorities for the coming years — and we look forward to working closely with Australian agencies and businesses to ensure that Australian communities gain increased confidence that their personal information is respected and protected.
The privacy landscape has evolved, community expectations have followed, and now our responses need to move to the next iteration.
Timothy Pilgrim PSM
Australian Information and Privacy Commissioner
1.0 Summary of results
Biggest privacy risks
In 2017, Australians believe the biggest privacy risks facing the community include:
- online services, including social media sites (mentioned by 32%)
- ID fraud and theft (19%)
- data security breaches (17%)
- risks to financial data (12%).
This result is largely stable compared to responses received in 2013.
The majority of Australians claim to be more concerned about the privacy of their personal information when using the internet than five years ago (69%), a consistent finding compared to the last two surveys. A new question this year revealed that more than eight in ten (83%) believe the privacy risks are greater when dealing with an organisation online compared with other means.
Personal information people are reluctant to provide
The four pieces of information that Australians are most reluctant to provide remains stable:
- financial details (mentioned by 42%)
- address (24%)
- date of birth (14%)
- phone numbers (13%).
Trust
The community was asked how trustworthy they considered 14 different types of organisations.
The highest levels of trust were recorded for:
- health service providers (79%)
- financial institutions (59%)
- state and federal government departments (both 58%).
The industries with the lowest levels of trust include social media (12%) and e-commerce (19%).
Australians will avoid dealing with organisations due to privacy concerns. The difference between the percentage of people who will avoid private companies and government agencies has widened slightly.
In 2017, one in six (16%) would avoid dealing with a government agency because of privacy concerns, while six in ten (58%) would avoid dealing with a private company, a 42 point gap. By contrast, there was only a 37 point gap (23% vs 60%) in 2013.
Use of personal information
A number of new questions revealed that while nearly half of Australians (46%) are comfortable with government agencies using their personal details for research or policy-making purposes, four in ten are not comfortable (40%), and the balance are still unsure.
Further, one-third (34%) of the community is comfortable with the government sharing their personal information with other government agencies. However, only one in ten (10%) is comfortable with businesses sharing their information with other organisations.
Only one in a hundred (1%) do not mind receiving unsolicited marketing information from organisations they had not dealt with before.
Similar to 2013, the large majority are concerned about organisations sending their personal information overseas (93%).
As in 2013, only a third of Australians are likely to trade personal information for benefits:
- 33% would trade personal information for rewards and benefits
- 32% would do so for better customer service
- one in five (20%) would do so for the chance to win a prize.
Activities considered a misuse of information
Australians’ views on misuse of information have remained stable. There was agreement among Australians, with nine in ten believing that the following are examples of personal information being misused:
- an organisation that a person has not dealt with before obtains their personal information (87%)
- personal information is revealed to other customers (87%)
- personal information is used for a purpose other than the one it was provided for (86%).
Social networking
The proportion of people who regret putting information on a social networking site increased from 17% in 2013 to 25% in 2017.
This coincides with a slight increase in the proportion thinking social networking is mainly a public activity (from 60% in 2013 to 63% in 2017) and a slight decline in the proportion believing it is a private activity (from 32% to 28%).
Tracking and storing online behaviour
Comfort with online tracking and online data storage remains low, with only one in five (21%) feeling comfortable with targeted advertising based on their online activities, and one in six (17%) feeling comfortable with social networking companies keeping databases of information on their online actions.
Smartphones and websites collecting information about users
Over eight in ten respondents (84%) use a smartphone.
People increasingly believe smartphone apps and websites collect information about users, with three quarters now believing this is the standard practice of both apps (66%) and websites (74%).
Steps taken to protect personal information
When it comes to protecting our own personal information, things haven’t changed much since 2013. Over three in five (61%) Australians do not regularly read online privacy policies and about half do not regularly shred documents (50%), clear their browsing history (50%), or adjust their privacy settings on social media sites (43%).
Biometric data
Our comfort level with providing biometric information is generally increasing.
The proportions of people who are somewhat or very concerned about using biometric information has reduced for:
- accessing a licensed pub, club, bar or hotel (58% concerned, down from 71% in 2013)
- accessing a place of work or study (46% concerned, down from 55% in 2013).
The proportion of people concerned about using biometric information to do day-to-day banking (56%) or for getting on flights (43%) are unchanged since 2013.
ID fraud and theft
Over one in ten (11%) Australians said that they have previously been a victim of identity fraud or theft. The proportion of people who know someone who has been the victim of identity fraud or theft has increased. It now stands at one in four (26%, up from 17% in 2007 and 21% in 2013).
The proportion of Australians that are concerned about identity fraud or theft is similar to that in 2013, at 69%.
Credit reporting
The large majority of people know what a credit rating is (81%). Of those who are aware, around two in five (38%) have tried to obtain their credit information.
Reporting malpractice
Nearly three in ten (28%) respondents said they had a problem with the way their information had been handled in the previous year.
Just over a third of Australians (37%) know that they can request access to their personal information that is held by government agencies or businesses. Nearly six in ten Australians (58%) believe they cannot do this.
When asked, nearly half (47%) say they are aware of the Privacy Commissioner, yet only one in fifteen (7%) said that they would report misuse of information to a Privacy Commissioner. Further, nearly half (47%) were unable to nominate an agency to make such a report to, and the most likely organisation would be the police (12%).
2.0 Background and objectives
The Office of the Australian Information Commissioner (OAIC) is an independent Australian Government agency established under the Australian Information Commissioner Act 2010 (AIC Act).
The OAIC has three primary functions:
- privacy functions, conferred by the Privacy Act 1988 (Privacy Act) and other laws
- freedom of information (FOI) functions, in particular, oversight of the operation of the Freedom of Information Act 1982 (FOI Act) and review of decisions made by agencies and ministers under that Act
- government information policy functions, conferred on the Australian Information Commissioner under the AIC Act.
The OAIC Australian Community Attitudes to Privacy Survey (ACAPS) aims to understand Australians’ changing awareness and opinions about privacy, as well as their expectations in relation to the handling of their personal information. The study also seeks views on a range of particular issues, including online privacy, credit reporting, and biometric information collection.
Wallis Market and Social Research (Wallis) was appointed to provide research services including data collection, reporting and visual representation of the data (in collaboration with Clemenger BBDO).
The objectives of the 2017 study include:
- to assist in the OAIC’s dispute resolution, regulation and strategy work, and communications work
- to provide information on privacy trends and developments for the OAIC’s stakeholders
- to map changes in community attitudes since the 2013 survey and to use this information as a benchmark for future studies.
Reading this report
The 2017 survey was completed using two starting samples — one to give 800 fixed line/mobile telephone interviews and the other to give 1,000 online panel interviews. Previous studies were conducted entirely by telephone. The change was in response to a growing amount of evidence that different people prefer to be contacted and interviewed in different ways — with people who are registered to complete surveys online (and those who choose to go online following an invitation in another mode) providing different types of response as well.
In effect, this multi-mode approach gives access to a far broader cross section of the Australian community, providing more accurate estimates than are possible if people are simply contacted by telephone or online. A fortunate bi-product of the change is the increase in the number of interviewees.
The change in methodology has had a small impact on the results. Questions need to be asked differently via telephone to online, and the differences in results between 2013 and 2017 largely relate to this mode effect. In particular, online respondents are required to type answers to unprompted questions to be coded later, whereas interviewers ‘code as they go’ if they can match the answer given to them to the code displayed. Thus some apparent changes in time series data reflect mode changes. Wherever the methodology can explain the movements in time series data this has been noted, and only genuine changes are noted as such.
Readers comparing this report with the 2013 report should, therefore, not compare absolute percentages unless the differences between results have been noted as significant.
Another departure from the past is in the way the survey was administered. The full questionnaire was timed at over 20 minutes in testing — too long to be deployed via mobile phone. The questionnaire was broken down into modules with different respondents answering different combinations of modules so that they would be engaged in survey completion for around 15 minutes. Thus readers will note that the number of people answering each question is slightly different and this relates to the modular approach. Attitudinal and demographic questions were asked of everyone (base=1,800) and the three other pathways through the questionnaire were asked of 1,222, 1,213 or 1,164 respondents.
3.0 Detailed findings
The 2017 ACAPS report covered a number of key areas:
- federal privacy laws and community understanding of their coverage
- understanding of the risks inherent in giving personal identified information to government and business
- attitudes towards business and government’s personal information data handling practices
- the trade-off between convenience, reward and giving personal information
- the prevalence of problems and how to deal with them
- personal responsibility relating to personal information
- attitudes towards the use of biometric data
- personal data and new technology
- ID fraud and theft
- credit reporting.
The answers to a questionnaire developed to capture information on these subjects are detailed under a number of related headings.
The survey allowed participants to complete a curated interview over the phone or to do an interview online. People answer slightly differently in the different modes (mode effect) and these are pointed out where they exist. The inclusion of paid online panellists also added a level of complexity to the findings and where these responses have affected time series data, it is noted. However, the telephone survey was comparable to the methodology used in previous years, so the effects of the change of methodology are known.
Irrespective of the mode of completion, all respondents were read or shown the following definition at the beginning of the survey to set the scope of questioning:
In Australia, privacy law relates to the protection of an individual’s ‘personal information’. This is any information about you that identifies you or could reasonably be used to identify you. For example, this includes things like:
- your name or address
- financial details
- photos
- your opinions and beliefs
- membership of groups and affiliations
- racial or ethnic origin
- health information (including genetic information)
- sexual preferences
- criminal record.
Federal privacy laws
The Privacy Act[1] is an Australian law that relates to the protection of an individual’s personal information including its collection, use, storage and disclosure. The Privacy Act came into force in 1988 and underwent substantial changes that came into effect in 2014.
Awareness of the Privacy Commissioner
Just under half (47%) of Australians are aware that there is an Australian Privacy Commissioner.
Awareness is higher amongst:
- those aged over 55 years (55% vs 43% of younger Australians)
- males (50% vs 44%).
Awareness is lower amongst people who are not in the workforce, not studying, and retired (all 31%).
Figure 1. Awareness of the Privacy Commissioner by gender and age
Q6: Were you aware that an Australian Government Privacy Commissioner exists to uphold privacy laws and to investigate complaints concerning the misuse of personal information?
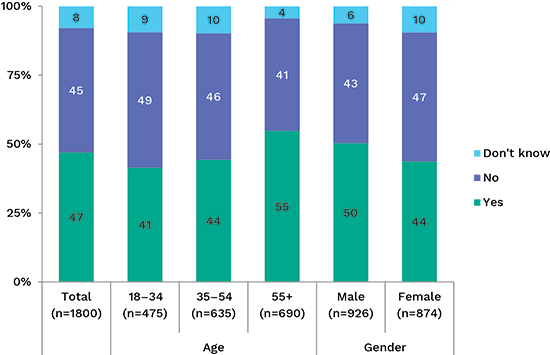
Base: All respondents (n=1800)
Entities covered by the Privacy Act
The Privacy Act covers most federal government departments and agencies, and businesses operating in Australia with a turnover greater than $3 million. There are a number of exemptions.[2] In 2015–16, one in eight (12%) of the phone enquiries to the OAIC that related to the privacy principles specifically related to these exemptions.[3]
Respondents who were aware of the Privacy Commissioner were read a list of types of organisations, and activities conducted by organisations, and asked whether they believed each was under the jurisdiction of the Privacy Act.
Australians appeared to overestimate the reach of the Privacy Act, with more than half of those who were aware of the Privacy Commissioner believing that each type of organisation listed was under the jurisdiction of the Privacy Act.
Among the organisations that are covered by the Privacy Act, Australians are confident that ‘federal government agencies’ (81%) and ‘medium to large Australian business’ (78%) are covered. They are less sure about ‘multinational organisations operating in Australia’ (64%).
The majority also mistakenly believe that various organisations are covered by the Privacy Act. Nearly eight in ten believe that ‘public schools and universities’ (77%), ‘businesses collecting work related information about employees’ (77%), and ‘state government agencies’ (76%) are covered. Seven in ten believe that the Privacy Act covers ‘media organisations’ (69%), ‘small Australian business’ (66%), and ‘political parties’ (64%) as well.
Figure 2. Understanding of entities covered by the Privacy Act
Q6 Which of the following do you think are under the jurisdiction of the Privacy Act?
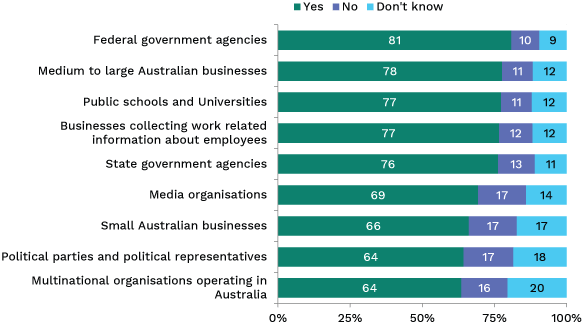
Base: Aware of the Privacy Commissioner (n=893)
General attitudes towards privacy and personal information
Public perception of the greatest privacy risks
Respondents were asked to list the areas which they believe pose the biggest privacy risks to people in Australia today. This was an open question, however, once the data was coded, five areas emerged which the public believe constitute the greatest risks:
- online services and social media sites (32%)
- ID fraud and theft (19%)
- data security/data breaches (17%)
- financial details/information/fraud (12%)
- personal details being too easily available/accessible/not secure (7%).
This was the same rank order of responses as in 2013, and stable when methodological differences are taken into account.
Figure 3. Biggest privacy risks facing people today
Q1. I’d like to start by asking you what you think are the biggest privacy risks that face people today in Australia?
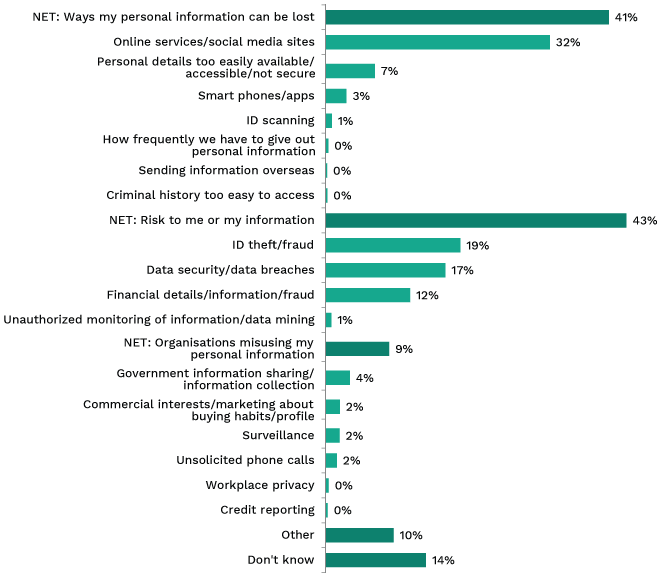
Base: All respondents (n=1800)
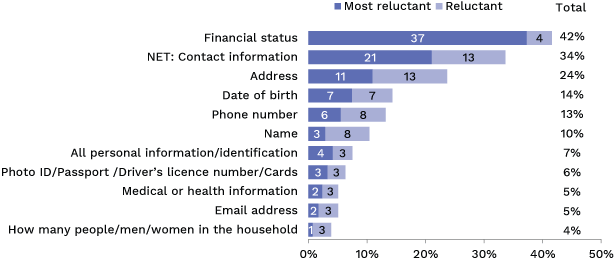
Information which Australians are reluctant to provide
Respondents were asked which types of information they are reluctant to provide. A small group (7%) report that they are reluctant to provide any information and an even smaller group (3%) does not mind sharing any information. One in ten (10%) were unsure about the types of information they would be reluctant to provide and a further one in ten (9%) declined to answer the question. Those who were willing and able to nominate specific types of information raised the following:
- Overall, people are most reluctant to provide ‘financial status’ (42%), and the proportion of those reluctant to provide this information is higher in older age brackets (from 37% amongst 18–34 year olds to 52% amongst those aged over 65 years).
- Contact information of various types was mentioned by over one in three people (34%), and in contrast to financial information, younger people were more reluctant to provide this information than older people (41% of 18–34 year olds versus 26% of those aged over 65 years). Specific contact details mentioned included:
- address (24%)
- date of birth (14%)
- phone number (13%)
- name (10%)
- email address (5%).
The rank order of the top five responses was the same as in 2013.
Other information raised included identification (7%), photo ID/passport/driver’s licence/cards (6%), medical or health information (5%), how many people in the household (4%), and a smaller proportion of respondents mentioned information such as sexual orientation, marital status, religion, ethnicity and buying/spending habits.
Table 1. Information Australians are reluctant to provide to businesses and government
| Information | Age | |||
|---|---|---|---|---|
| Total (n=1800) | 18–34 (n=475) | 35–54 (n=635) | 55+ (n=690) | |
| Financial status | 42 | 37 | 40 | 48 ↑ |
| NET Contact information | 34 | 41 | 34 | 26 ↓ |
| Address | 24 | 30 ↑ | 25 | 17 ↓ |
| Phone number | 13 | 16 | 13 ↑ | 10 |
| Name | 10 | 14 | 11 | 7 |
| Email address | 5 | 5 | 5 | 4 ↓ |
| Date of birth | 14 | 13 | 18 | 12 |
| All personal information/identification | 7 | 7 | 8 | 8 |
| Photo ID/passport/driver’s licence number/cards | 6 | 6 | 7 | 6 |
| Medical or health information | 5 | 5 | 4 | 6 |
| How many people/men/women in the household | 4 | 5 | 4 | 3 |
| Work status and related information | 2 | 3 | 1 | 1 |
| Sexual orientation | 2 | 2 | 1 | 1 |
| Religion | 2 | 2 | 1 | 2 |
| Marital status | 1 | 1 | 1 | 1 |
| Ethnicity | 1 | 1 | 1 | 0 ↓ |
| Buying preferences/spending habits | 0 | 0 | 0 | 0 |
| Other | 9 | 10 | 8 | 9 |
| None | 3 | 2 | 4 | 5 |
| Don’t know | 10 | 12 | 10 | 7 |
| Refused | 9 | 8 | 8 | 10 |
Q2: What types of information are you reluctant to provide?
Base: All respondents (n=1800)
Information which Australians are most reluctant to provide
When asked which one of these pieces of information they were most reluctant to provide, financial information was by far the most often mentioned (37%). The items next most mentioned included address (home and email), date of birth and phone number. The rank order of these responses, and the large gap between financial information and the other items, was the same as in 2013.
Figure 4. Information Australians are more reluctant to provide to businesses and government
Q2. What types of information are you reluctant to provide?
Q3. And which one of these [list answers given for Q2] do you feel MOST reluctant to provide?
Base: All respondents (n=1800)
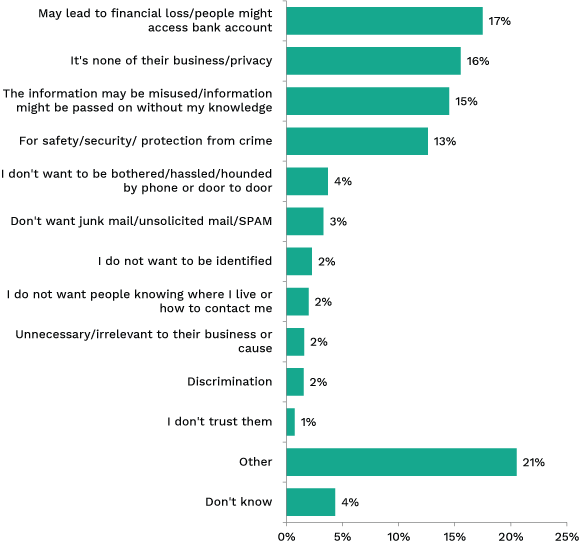
Reasons for reluctance to provide information
The reasons for this reluctance are shown in the following chart.
Coinciding with being most reluctant to divulge information relating to their financial status, people were most likely to be reluctant to provide information because ‘it may lead to financial loss/people might access bank account’ (mentioned by 17%). Other reasons frequently mentioned included:
- ‘it’s none of their business’ (16%)
- ‘this information may be misused/passed on without my knowledge’ (15%)
- ‘for safety/security/protection from crime’ (13%).
These four reasons were the same four reasons most mentioned in the 2013 survey.
Figure 5. Reasons for reluctance to give key piece of information
Q4 What is your MAIN reason for not wanting to provide [answer from Q3]?
Base: All respondents able to mention information they were reluctant to provide (n=1440)
The responses varied depending on the type of information a person was most reluctant to provide, for example:
- Those most reluctant to provide financial information were most likely to do so because it might ‘lead to financial loss/people might access bank account.’
- Those most reluctant to provide their address most often mentioned ‘it’s none of their business’ as the reason for being reluctant to hand over this information.
- Those most reluctant to provide their date of birth were most likely to do so because it ‘might be misused/information might be passed on without my knowledge.’
- Those most reluctant to provide their phone number were most likely to do so because ‘they did not want to be bothered.’
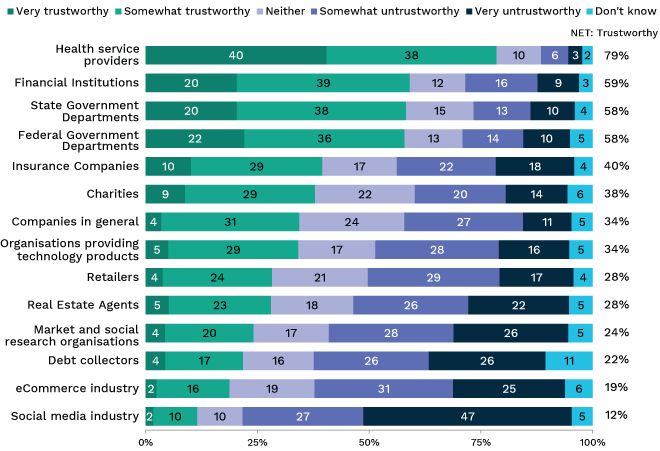
Trust
Australians were asked the extent to which they trust different types of organisations to look after their personal information. Health service providers continue to be the most trusted of the organisations with eight in ten Australians (79%) trusting them, with financial institutions (59%), and government departments (58%), maintaining second and third rankings respectively. Insurance companies (40%) and charities (38%) are trusted by four in ten.
Just over a third trusts technology companies (34%) and companies in general (also 34%), and three in ten trusts retailers (28%) or real estate agents (also 28%). Market and social researchers have the trust of only a quarter (24%) of the people who took part in the survey — marginally ahead of debt collectors (22%), and e-commerce companies (19%) who are trusted by slightly over one in five people.
The social media industry (12%) remains the least trusted of the types of organisations considered.
Trust declines with increasing age, with people aged under 35 being significantly more likely than people aged over 55 to trust organisations of all types.
Also, a distinction between online and phone responses was noted on this question, with phone responders generally reporting higher net trust than online responders. The figures reported below combine both phone and online responses.
Figure 6. Australians’ trust in organisations
Q8 How trustworthy or untrustworthy would you say organisations are with regard to how they protect or use your personal information?
Base: All respondents in streams 1 and 2 (n=1164)
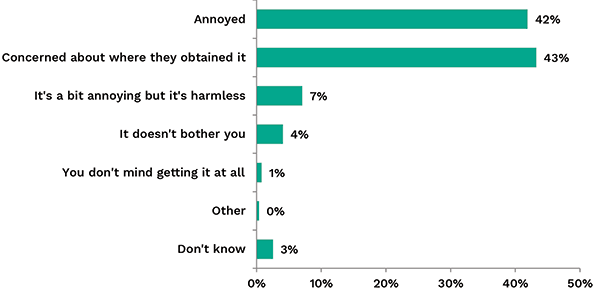
Unsolicited marketing
Access to personal information allows businesses to tailor services and marketing materials to suit the individual. A survey of the direct marketing industry conducted and published in December 2016 by the Australian Communications and Media Authority (ACMA) shows that most of the industry’s members now keep centralised linked databases of marketing prospects and conduct micro targeted marketing, rather than mass marketing.[4]
The public continues to dislike direct marketing. Only 1% of people do not mind receiving unsolicited marketing information from organisations that they have had no prior dealings with. Four in ten (42%) find it annoying and the same proportion (43%) worries where the organisation got their details from.
Figure 7. Reaction to unsolicited marketing activity
Q33: Which of the following statements BEST DESCRIBES how you GENERALLY feel when organisations that you have NEVER DEALT WITH BEFORE send you unsolicited marketing information?
Base: All respondents in streams 1 and 3 (n=1222)
Overseas data transfer
Australians remain concerned about having their personal information sent overseas by organisations. Nine in ten Australians feel either very concerned (61%) or somewhat concerned (32%) about this practice, with only one in twenty (5%) being unconcerned. People aged under 35 are the least worried, and show less strength of concern than older age groups.
Figure 8. Feelings about personal information being sent overseas
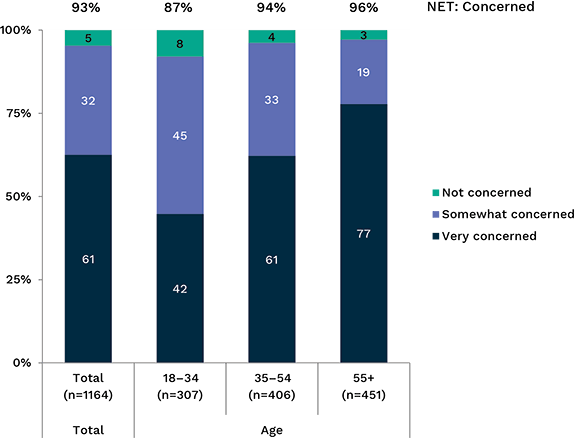
Q13: How concerned are you about organisations sending their customers’ personal information from Australia to overseas?
Base: All respondents in streams 1 and 2 (n=1164)
Businesses sharing personal data
Eight in ten Australians (79%) are uncomfortable with businesses sharing their personal information with other businesses. Women and older Australians show greater concern with this practice.
Only one in ten (10%) Australians are comfortable with their personal data being shared, and among Australians overall, less than one in twenty (4%) are very comfortable.
Figure 9. Australians’ comfort with businesses sharing personal information with other organisations
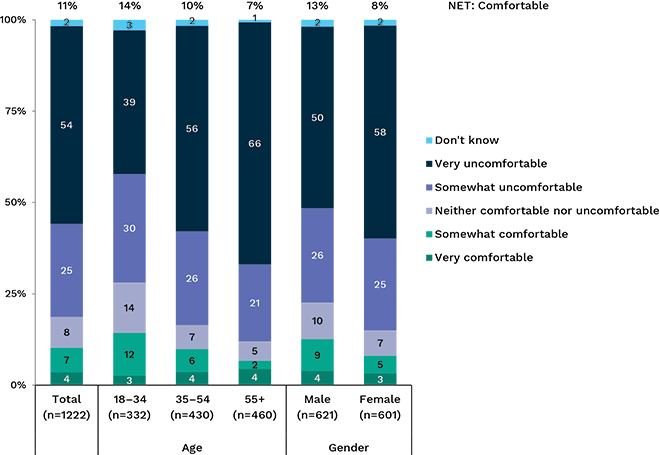
Q14B: How comfortable or uncomfortable are you about businesses sharing your personal information with other organisations?
Base: All respondents in streams 1 and 3 (n=1222)
Governments sharing personal data
Australians are less concerned with government agencies sharing personal information about them with other government agencies than they are about businesses sharing information with other organisations. One third (33%) said they are comfortable about this, compared to 10% being comfortable with businesses sharing information. However, nearly half (49%) are uncomfortable.
Comfort is higher among men (39%) than women (29%). Another interesting point of difference is between higher and lower income earners — people living in households earning under $75,000 (31%) are less comfortable with data sharing than those earning more than this (41%). People who did not declare their income in the survey were the least comfortable with the concept of information sharing (23%).
Figure 10. Australians’ comfort with government agencies sharing personal information
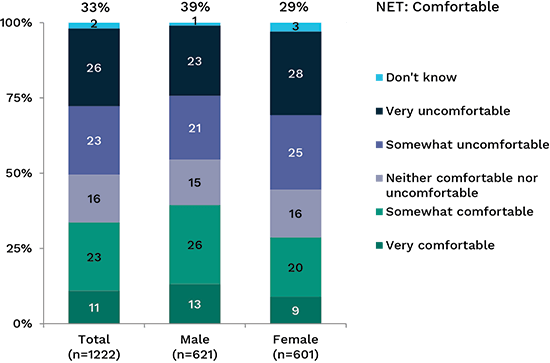
Q14C: And how comfortable or uncomfortable are you with government agencies sharing information with other government agencies?
Base: All respondents in streams 1 and 3 (n=1222)
Government data for research
Australians are more comfortable with government agencies using their personal data for the purposes of research, improved services or policy development. Just under half (46%) are comfortable with this. Men are slightly more comfortable (48%) than women (43%).
Of those who were uncomfortable with this idea, there was a significantly higher proportion of women (34%), compared to men (26%).
Figure 11. Australians’ comfort with government using their information for research
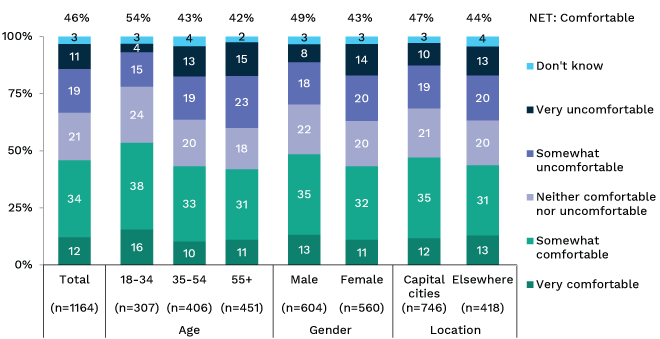
Q11B: How comfortable or uncomfortable would you be with the personal information that you’ve provided to government agencies and departments being used for research, service development or policy development purposes?
Base: All respondents in streams 1 and 2 (n=1164)
Privacy problems and complaints
Over a quarter of Australians (28%) claimed to have experienced a problem with the way their personal information had been handled in the last 12 months.
The OAIC fielded 2,128 complaints from the public in 2015–16 and 11,759 telephone queries of which the majority (10,370) related to the Australian Privacy Principles (APPs).[5]
Reporting problems
In 2017 Australians were asked which organisations they would report misuse of information to. As the chart below indicates, only just over half of people (53%) were able to nominate any organisation. The police were nominated most often, with 12% of Australians saying they would turn to them to report the misuse of their personal information, while 9% said they would be most likely to contact the organisation involved. These two responses were also the most common in the 2013 survey.
Only a small proportion of Australians (7%) know to go to the Privacy Commissioner (federal or state) if they want to report the misuse of their personal information.
Figure 12. Organisations people would report misuse of personal information to

Q17: If you wanted to report misuse of your personal information to someone, who would you be MOST likely to contact?
Base: All respondents in streams 2 and 3 (n=1213)
What is a misuse of personal information?
A lack of understanding about who to complain to and the prevalence of problems with data handling suggests that the actual number of problems experienced is much higher than those reported. This understatement of the prevalence of problems is compounded further if Australians do not understand what they can complain about. Analysis of complaints information to the OAIC shows that half of the complaints relate to five sectors:
- finance and superannuation (18% of complaints)
- the Australian Government (11%)
- health service providers (10%)
- telecommunications (8%)
- credit reporting bodies (7%).
Telephone enquiries far outweigh the number of complaints and the main areas for query are related to the APPs, in particular:
- APP 6 — use or disclosure (21% of queries about the APPs)
- APP 12 — access to personal information (15%)
- APP 11 — security of personal information (14%)
- APP 3 — collection (12%).
Over the last three waves of this survey, Australians have been presented with a number of scenarios and asked if they think these are a misuse of personal information. The scenarios have changed slightly year to year but they relate to the APPs.
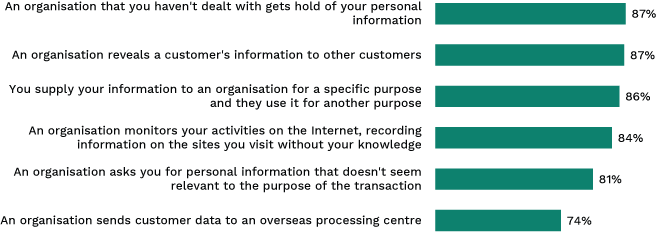
In 2017, nine in ten Australians considered a misuse of information to be:
- an organisation that you haven’t dealt with gets hold of your personal information (87%) (APP 6)
- an organisation reveals a customer’s information to other customers (87%) (APP 11)
- you supply your information to an organisation for a specific purpose and they use it for another purpose (86%) (APP 6).
Over eight in ten Australians believe that an organisation monitoring their activities on the internet, and recording information on the websites they visit without their knowledge is misuse (84%). Further, 81% believes that an organisation asking them for personal information that doesn’t seem relevant to the purpose of the transaction (81%) is misuse. Both of these instances relate to APP 3. Three quarters (74%) believes that sending customer data to an overseas processing centre is misuse of that information (APP 8 — Cross-border disclosure).
Only the last two of these, relating to relevance and processing information overseas, are considered to be significantly less of a problem among people aged under 35 compared with people aged over 55.
Figure 13. What is a misuse of information?
Q12: Which of the following instances would you regard to be a misuse of your personal information?
Base: All respondents in streams 1 and 2 (n=1164)
A distinction between online and phone responses was also noted on this question, with phone responders generally closer to the 2013 response than online responders. The figures reported above combine phone and online responses.
Accessing personal information
APP 12 of the Privacy Act requires that organisations holding personal information about an individual give that person access to that information on request. There are some caveats on situations in which access cannot be granted.[6]
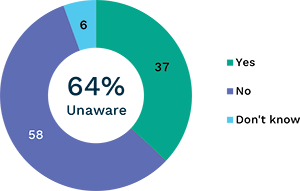
This study found that only just over a third (37%) of Australians are aware that they can request to access their personal information from government agencies and businesses which hold the information. The majority are either unaware (58%) or unsure (6%) that they are able to access this information.
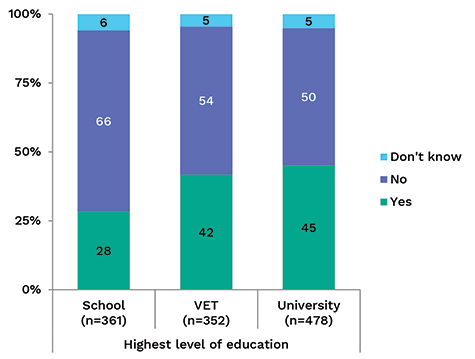
Awareness of the ability to access personal information is highest amongst those who have been to university (45%), but still under half of this group is aware.
Figure 14. Awareness of the ability to access personal information from government and business
Q15A: Are you aware that you can request to access your personal information from businesses and government agencies?
Base: All respondents in streams 2 and 3 (n=1213)
Figure 15. Awareness of ability to access personal information from government and business — by highest level of education
Q15A: Are you aware that you can request to access your personal information from businesses and government agencies?
Base: All respondents in streams 2 and 3 (n=1213)
Data breaches
From 22 February 2018, businesses will be obligated to report data breaches to the OAIC and to the people whose data has been lost or released inappropriately. The Notifiable Data Breaches (NDB) scheme will apply to all businesses, government agencies, and organisations covered by the Privacy Act.
The introduction of this scheme is strongly supported by Australians. Nearly everyone agrees that if a government agency (95%) or a business (94%) loses their information they should be told about it. Over eight in ten people agrees strongly with mandatory data breach reporting.
Figure 16. Support for being informed about the loss of personal information
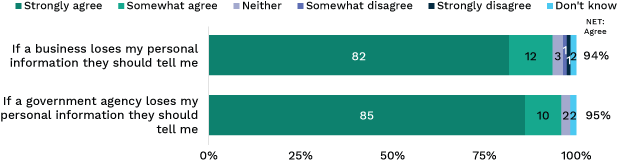
Q14A/AA: If a government agency/business loses my personal information they should tell me.
Base: All respondents in streams 1 and 3 (n=1222)
Personal responsibility
Measures taken to protect personal information
Findings from this research suggest that people are increasingly concerned about information security — 69% of Australians are more concerned about their online privacy than five years ago, and 83% think there are greater privacy risks dealing with an organisation online compared to in traditional settings.
It is within this context that Australians were asked how often, if ever, they took a number of measures in order to protect their personal information. Their answers are summarised in the chart below.
Figure 17. Measures taken by Australians to protect their personal information
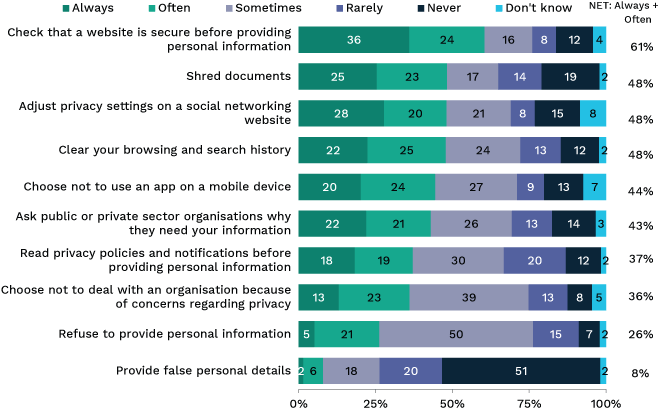
Q21: In order to protect your personal information, do you…
Base: All respondents in streams 1 and 3 (n=1222)
The steps that Australians take most often to protect personal information were similar in 2017 to 2013, with most differences relating to the survey methodology. The exception was in reading privacy policies. The proportion of people who always or often ‘read privacy policies before providing personal information’ dropped from 44% in 2013 to 37% in 2017.
As the following table indicates, young people are less likely to take steps to protect their personal information than older respondents, with the exception that those aged 18–34 are more likely to adjust privacy settings on a social networking website.
Males and females are equally likely to protect their personal information, with the exception that males are more likely to check that a website is secure before providing personal information, and to clear their browsing and search history.
Those who had completed a high school education or less are less likely overall to take steps to protect their personal information.
Table 2. Measures taken by Australians to protect their personal information — by demographics
| Measure taken | Total (Base =1221) | Age | Gender | Highest level of education | |||||
|---|---|---|---|---|---|---|---|---|---|
| 18–34 (Base =331) | 35–54 (Base =430) | 55+ (Base =460) | Male (Base =621) | Female (Base =600) | School (Base =368) | VET (Base =349) | Uni (Base =487) | ||
| Check that a website is secure before providing personal information | 61 | 59 | 65 | 57 | 65 ↑ | 56 ↓ | 53 ↓ | 67 ↑ | 64 |
| Shred documents | 48 | 30 ↓ | 51 | 63 ↑ | 45 | 51 | 48 | 51 | 46 |
| Adjust privacy settings on a social networking website | 48 | 60 ↑ | 50 | 34 ↓ | 45 | 51 | 38 ↓ | 55 ↑ | 56 ↑ |
| Clear your browsing and search history | 48 | 45 | 50 | 49 | 52 ↑ | 44 ↓ | 44 | 52 | 51 |
| Choose not to use an app on a mobile device | 44 | 37 ↓ | 49 | 47 | 45 | 44 | 41 | 50↑ | 43 |
| Ask public or private sector organisations why they need your information | 43 | 35 ↓ | 44 | 50 ↑ | 44 | 42 | 36 ↓ | 49 ↑ | 44 |
| Read privacy policies and notifications before providing personal information | 37 | 30 ↓ | 39 | 42 | 37 | 38 | 31 ↓ | 44 ↑ | 35 |
| Choose not to deal with an organisation because of concerns regarding privacy | 36 | 33 | 38 | 37 | 38 | 35 | 30 ↓ | 41 ↑ | 37 |
| Refuse to provide personal information | 26 | 20 ↓ | 27 | 31 ↑ | 30 | 23 | 25 | 27 | 27 |
| Provide false personal details | 8 | 11 ↑ | 10 | 3 ↓ | 10 | 6 | 7 | 6 | 13 ↑ |
Avoiding dealing with organisations due to privacy concerns
Australians were asked whether they had decided not to deal with either a government agency or private company because of concerns over the protection or use of personal information.
As was the case in 2013, Australians are more likely to avoid dealing with private companies than government agencies because of privacy concerns, although the gap between them has widened slightly:
- 16% have decided to avoid dealing with a government agency because of privacy concerns (a decline vs 23% in 2013)
- 58% have decided to avoid dealing with a private company because of privacy concerns (vs 60% in 2013).
Figure 18. Proportion of Australians who have decided not to deal with an organisation because of concerns over the use of personal information
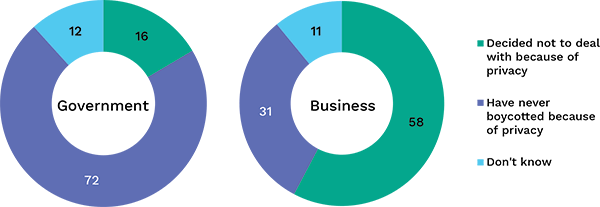
Q18/19 Have you ever decided not to deal with a government agency/private company because of concerns over the protection or use of your personal information?
Base: All respondents in streams 1 and 3 (n=1222)
Those aged 18–24 are less likely to avoid dealing with a private company because of concerns (41%).
While an increasing proportion of Australians have decided not to deal with an organisation because of privacy concerns in the last 10 years, this rise has been more noticeable concerning private companies (from 36% in 2007 to 58% in 2017), than government agencies (from 12% to 16%).
Providing personal information for benefits
Participants were asked whether rewards and benefits, a prize or better customer service would encourage them to share their personal information. As the chart below shows, a minority say they are likely to give information in exchange for a tangible gain. They are more likely to do so in exchange for rewards and benefits (33%), or better customer service (32%) than for the chance to win a prize (20%).
Figure 19. Australians’ willingness to give personal information in exchange for a benefit
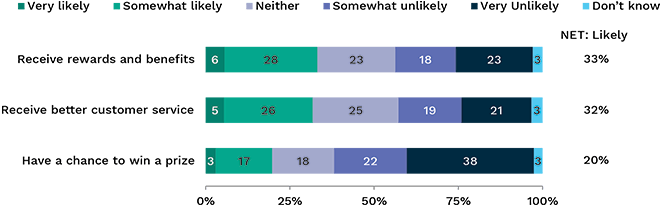
Q9/10/11: How likely or unlikely are you to provide your personal information to an organisation if it meant you would receive rewards and benefits/the chance to win a prize/better customer service?
Base: All respondents in streams 1 and 2 (n=1164)
Australians aged 18–34 are more likely to exchange information than those aged 35 or over for:
- rewards and benefits (44% would do so compared to 29% among those aged 35 or over)
- a chance to win a prize (27% vs 17%)
- receiving better customer service (40% vs 28%).
Females are more likely to give up information for a prize (23% vs 16% for males). There were no other differences across demographics.
Biometric data
The use of biometric data has increased rapidly in recent years, and has been introduced to air travel, mobile phones, building security, cars and schools, among others. Participants were asked if they were concerned about using biometric data in certain situations.
Coinciding with increasing usage of biometric data, being ‘somewhat’ or ‘very’ concerned about its use has reduced for:
- going to a licensed pub, club, bar or hotel (from 71% in 2013 to 58% in 2017)
- getting into your place of work or study (from 55% in 2013 to 46% in 2017).
However, levels of concern about using biometric information to do day-to-day banking (53% in 2013 and 56% in 2017) or for getting on flights (40% in 2013 and 43% in 2017) are unchanged.
In 2017, over one in two (55%) participants indicated they were concerned about using biometric data to ‘use tech devices (such as smartphone or wearable device, such as a fitness tracker)’.
Figure 20. Concern with using biometric data in a number of day-to-day situations
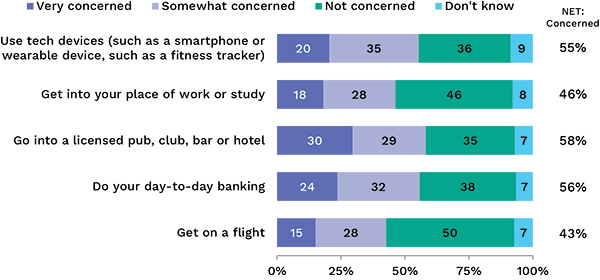
Q37: How concerned are you about using biometric information for you to…
Base: All respondents in stream 1 and 3 (n=1222)
The only significant differences among demographics was that there tended to be less concern about using biometric data among people aged over 55:
- doing day-to-day banking (50% of those aged 55 or over were concerned compared to 59% of those aged under 55)
- getting into your place of work or study (38% vs 50%)
- getting on a flight (36% vs 45%).
One in five people had no concerns about the use of biometric information in any of the situations suggested to them (20%).
Internet and smartphones
When respondents were asked to name the biggest privacy risk that people face today, they nominated ‘online services and social media sites’. Here we explore some of the behaviours and attitudes in this space, specifically:
- how the level of risk is perceived to have changed over time
- online behaviours such as use of smartphones, shopping online and the reading of privacy policies
- perception of the extent to which personal information is collected by websites and smartphone apps
- the level of comfort with online tracking and the display of targeted advertising.
Concern about personal information on the internet over time
Technology changes relatively quickly. Since 2012 the following trends are evident:
- traffic to websites from mobile devices surpassed desktops in November 2016 (in 2012 mobile accounted for around 15% of traffic[7])
- catch-up TV and streaming services are increasingly supplanting broadcast TV, with estimates that one in seven f Australians no longer view commercial TV on a typical day
- there has been a large increase in government services accessed and delivered online including rapid expansion of the MyGov portal, increased contact with the Australian Taxation Office, and the 2016 Census which was conducted largely online for the first time.
Given the rapidly changing digital environment, a key question is whether Australians feel more or less secure about the privacy of their personal information online. To gain some insight into this, participants were asked whether they were more or less concerned about the privacy of their personal information while using the internet compared to five years ago.
In 2013, three-quarters (74%) reported that they were more concerned than five years prior. We continue to see this perception of a less secure internet in 2017, with seven in ten (69%) continuing to report that they are more concerned. Despite the apparent small decline, when accounting for the methodological differences, this figure is in line with 2013.
Figure 21. Change in levels of concern with the privacy of personal information online compared to five years ago — year on year
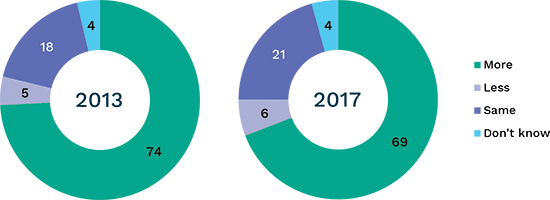
Q29: Are you more or less concerned about the privacy of your personal information while using the internet than you were five years ago?
Base: All respondents in streams 2 and 3 (n=1213)
This perception of concern is largely consistent among Australians. There is, however, one interesting difference to the pattern among 18–34 year olds — one in nine (11%) of this group reports that they are less concerned about their privacy compared to five years ago (vs 4% aged over 34). Although this survey was only conducted with adult Australians, it does raise a question about levels of concern about the privacy of information online among younger Australians.
Figure 22. Change in levels of concern with the privacy of personal information online compared to five years ago — by age
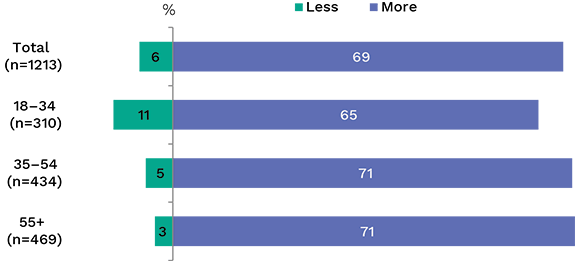
Q29: Are you more or less concerned about the privacy of your personal information while using the internet than you were five years ago?
Base: All respondents in streams 2 and 3 (n=1213)
Frequency of purchasing products online
Online shopping presents a convenient option for people in a wide range of retail categories. Online shoppers continue to purchase from established large retailers, yet are increasingly shopping at smaller businesses, using streaming services and food deliveries.[8]
The majority of Australians (84%) buy products online, with 38% shopping online at least monthly. Just under half (46%) shop online less frequently. There are a range of factors which influence the propensity with which Australians shop online, and the most notable of these are age and income.
Figure 23. How often products are purchased online
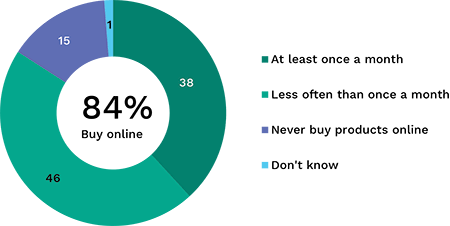
D6: How often do you buy products online?
Base: All respondents (excluding refused) (n=1781)
Online shopping is very prevalent amongst those aged 18–54 years (90%), and comparably less prevalent among older Australians (72%).
Figure 24. How often products are purchased online by age
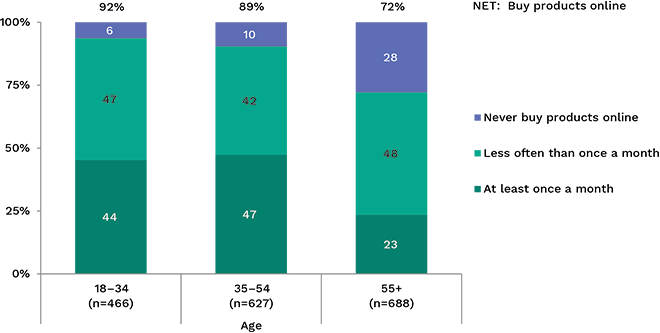
D6: How often do you buy products online?
Base: All respondents (excluding refused) (n=1781)
In addition to age, income is also linked to both the propensity and frequency of shopping online. Among members of households earning more than $100,000 per annum, nearly all (94%) shop online, with nearly six in ten (57%) doing so at least monthly. Conversely, around three-quarters (74%) of those living in households earning less than $25,000 ever shop online, and just over a quarter (27%) do so monthly.
Figure 25. How often products are purchased online by income
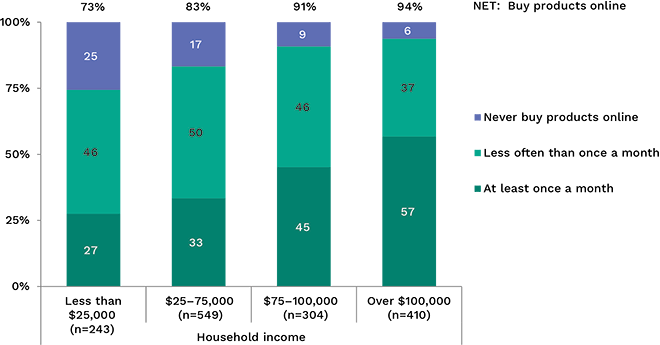
D6: How often do you buy products online?
Base: All respondents (excluding refused) (n=1781)
Risks attached to dealing online
Despite Australians’ willingness to shop online, and interact with organisations online, they believe that dealing with organisations in this way is inherently more risky from a privacy point of view than using more traditional channels, such as going into a branch or completing paperwork. Over eight in ten (83%) believe the risks were greater online. One in ten (11%) believe that online shopping was no more risky than other methods, while the remainder (6%) were unsure.
Despite online interactions being perceived to be more risky than traditional methods, Australians continue to engage online. However, we note that nearly six in ten (58%) have decided not to deal with an organisation due to privacy concerns, and that only a minority is willing to readily trade personal information for benefits. Thus, while the risk to personal information is often mitigated by convenience, it is not always the case.
Figure 26. Perceived risk to privacy dealing with organisations online versus traditional methods
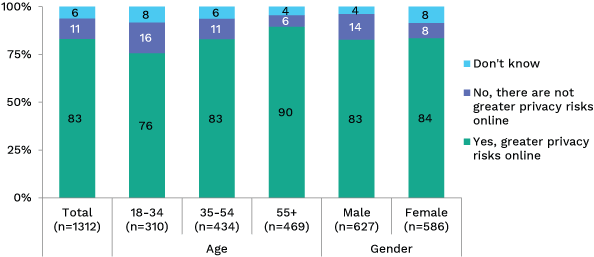
Q29A: Generally speaking, do you believe there are greater privacy risks when dealing with an organisation online compared to traditional settings like going into a branch or on paper?
Base: All respondents in streams 2 and 3 (n=1213)
The perceived level of risk in dealing with organisations online compared to in a traditional way varies considerably by age, although the majority in each age group perceives dealing with organisations online as riskier. Three-quarters (76%) of 18–34 year olds believe dealing with an organisation online is riskier, compared with eight in ten (83%) 35–54 year olds, and nine in ten (90%) of those aged 55 years and over.
Collection of information by apps and websites
Websites and apps are firmly embedded in the everyday life of the majority of Australians. It is therefore important to consider Australians’ perception of the extent to which apps and websites collect personal information from users.
Websites may collect information about users via directly asking for users to input their details, or by tracking their behaviour.
All respondents were asked whether they believe websites collect visitor information, to gauge the extent to which the public expects the websites they use to collect information about them.
Overall three-quarters (74%) believe that all (29%) or most (44%) websites collect information about users. This is similar to 2013 where seven in ten (70%) believed all or most websites collected personal information.
Australians aged between 18–44 years were somewhat more likely than those aged 45 or over to believe all websites collect information about visitors (35% vs 25%).
Figure 27. Perceptions of the proportion of websites that collection information about the people who use them
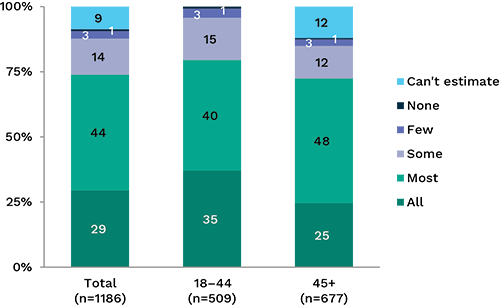
Q24: Thinking now about using the internet. What proportion of websites do you think collect information about the people who visit them? Would you say it is...
Base: All respondents in streams 2 and 3 (n=1213)
Respondents were asked what proportion of apps they believe collect information about the people who use them.
With the increase in smartphone usage in recent years Australians’ perception of the extent to which the apps they are using are collecting their personal information has also increased.
Two-thirds (66%) believe that all (31%) or most (34%) apps collect information about their users. This is an increase from 2013, where six in ten (59%) believed that all or most smartphone apps collected personal information about users.
Figure 28. Proportion of apps that collect information about the people who use them
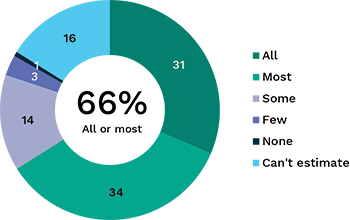
Q24A: Now thinking about your smartphone. What proportion of smart phone apps collect information about the people who use them? Do you think it is...
Base: All respondents in streams 2 and 3 (n=1213)
Attitudes towards search engines and social networking sites tracking online behaviour
On balance, Australians are uncomfortable with websites and online services maintaining databases of individual information and behaviours to develop targeted online advertisements or provide other customised online experiences. Australians dislike both the targeted advertising and the storing of information about what they have said and done online.
Level of comfort with online advertising targeted through users’ online activity
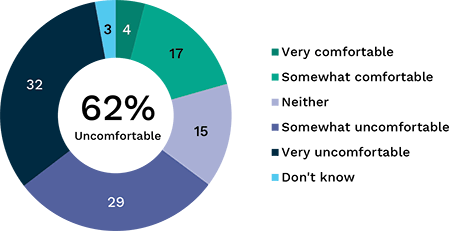
Just over six in ten (62%) Australians are uncomfortable with advertising on search engines and social media targeting them based on what they have said and done online, while one in five (21%) are comfortable. This is a similar result to 2013 where seven in ten (69%) were uncomfortable.
A sizable proportion feel strongly about this activity, with a third (32%) stating that they are very uncomfortable receiving such advertising.
Figure 29. Level of comfort with search engines and social media sites targeting advertising based on online behaviour
Q25A: As you may be aware, search engines and social networking sites track your internet use in order to do things like target advertising at you. How comfortable are you with... search engines and social media sites targeting advertising at you based on what you have said and done online?
Base: All respondents in streams 2 and 3 (n=1213)
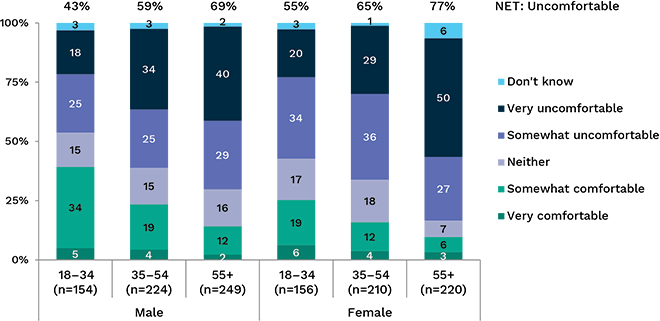
Younger Australians are somewhat less concerned with targeted advertising than middle-aged and older Australians, with half (49%) of those aged under 35 years old reporting that they are uncomfortable versus two-thirds (67%) of those aged 35 years or older. Gender is also a factor influencing levels of comfort with online targeted advertising, with a higher proportion of males being comfortable versus females (25% vs 17%). There is also a relationship between gender and age, with the most comfortable being 18–34 year old males (39%), and the least comfortable being females aged 55 and over (10%). Indeed, half (50%) of females aged over 55 years reported being very uncomfortable with online targeted advertising.
Figure 30. Level of comfort with search engines and social media sites targeting advertising based on online behaviour — gender by age
Q25A: As you may be aware, search engines and social networking sites track your internet use in order to do things like target advertising at you. How comfortable are you with… search engines and social media sites targeting advertising at you based on what you have said and done online?
Base: All respondents in streams 2 and 3 (n=1213)
Databases capturing online activity
Just over two-thirds (68%) of Australians are uncomfortable with search engines and social media sites keeping databases of their online activity, with four in ten (39%) being very uncomfortable.
There are some people (17%) who are comfortable with this activity. As with targeted online advertising, comfort with the maintenance of databases has an inverse relationship with age. A quarter (26%) of 18–34 year olds are comfortable with social media sites and search engines maintaining databases of their online activity, versus one in eight (12%) of those aged 55 or over. However, unlike targeted advertising, there is little difference between males and females.
Figure 31. Level of comfort with search engines and social networking keeping data bases of online activity
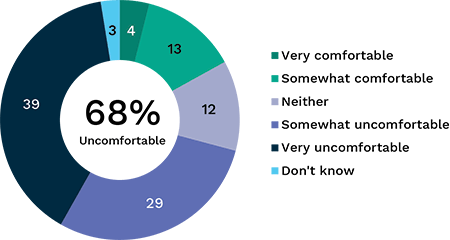
Q25B: As you may be aware, search engines and social networking sites track your internet use in order to do things like target advertising at you. How comfortable are you with… search engines and social media sites keeping databases of information on what you have said and done online?
Base: All respondents in streams 2 and 3 (n=1213)
Social networking — public or private?
A common feature of social networks is the ability to filter who can see and interact with content which is posted, for example, an individual may set restrictions so that only their friends may view their social media profile.
It is interesting to understand the extent to which Australians perceive social networking to be largely sharing with their immediate friends (a mainly private activity) or a more public activity which can be seen by many people.
The majority (63%) believes that social networking is mainly a public activity, a slight change from 2013 (60%). However, there continues to be a substantial minority (28%) who see social networking as mainly a private activity.
Figure 32. Perception of social networking as a public versus private activity
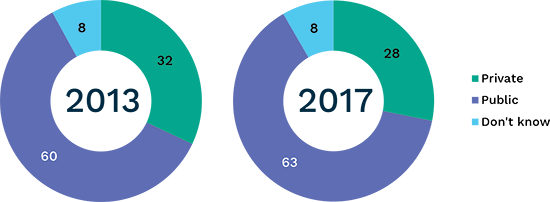
Q27: Do you think that social networking is... mainly a private activity, where users share information with their friends or mainly a public activity where users publish information which can be seen by many people?
Base: All respondents in streams 2 and 3 (n=1213)
There is little difference between Australians with different demographic characteristics. It is possible that the perception of social networking as mainly public/private is related to the way people use social networking and the platforms they use, rather than demographic characteristics.
Regret over material posted on social networks
Many Australians carry devices that enable them to produce content, such as a written opinion or a photo, and share it publicly almost instantaneously. This lack of a barrier to sharing content with friends, colleagues, and the world can lead to moments when action outpaces better judgement. In these instances, Australians may regret posting content on a social networking site.
Respondents to the survey were asked whether they had ever posted information to a social networking site which they later regretted sharing. Overall, a quarter (25%) had done so.
There was a marked difference by age, with four in ten (40%) 18–34 year olds saying they had done this versus one in eight (12%) aged 55 years or over.
These results are a large shift from 2013, where only one in six (17%) had posted something to a social networking site which they later regretted.
Figure 33. Regret relating to material posted on a social networking site
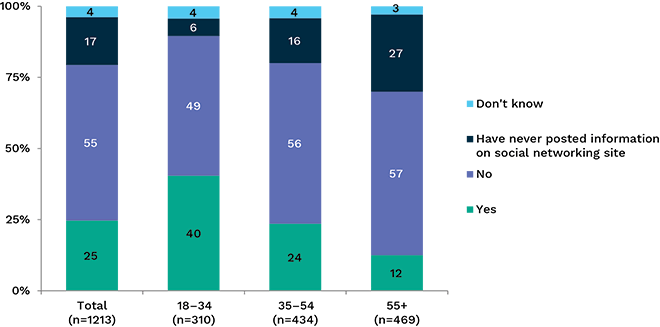
Q26: Have you ever put any information on a social networking site that you’ve later regretted sharing with others?
Base: All respondents in streams 2 and 3 (n=1213)
Privacy policies on websites
Despite seven in ten (69%) of Australians being more concerned about their online privacy than five years ago, a declining proportion say they normally read website privacy policies (from 44% in 2013 to 29% in 2017).
Figure 34. Reading privacy policies
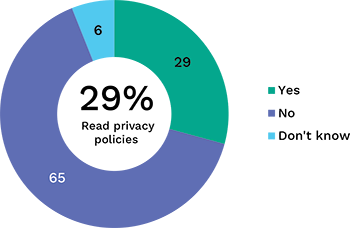
Q30: Do you normally read the privacy policy attached to any internet site?
Base: All respondents in streams 2 and 3 (n=1213)
While Australians’ tendency to read website privacy policies did not vary by demographics, it did vary by attitudes and experience. Those who are very concerned about being a victim of identity fraud (45%) or who have experienced identity fraud themselves or knew someone who had (38%) are more likely to read privacy policies.
The survey participants who read website policies were asked to describe the impact these have on them. The main response was that they help respondents to make a decision on whether or not to use the website (mentioned by 47%).
Table 3. Impact of seeing or reading privacy policies on attitudes towards the site
| Impact | % (Base=358) |
|---|---|
| NET: Positive impact of seeing privacy policies | 72 |
| Helps me decide whether to use the site or not | 47 |
| Good idea/approve of the privacy policy/prefer to see/respect sites for having them | 29 |
| Feel more confident/comfortable/secure about using site | 29 |
| Appear more honest/trustworthy/responsible/legitimate | 18 |
| NET: Negative aspects of privacy policies | 39 |
| Still apprehensive about sites that have them/don’t trust them/not convinced | 20 |
| Made me more cautious/aware when using the internet generally | 22 |
| Too long/complicated to read — it didn’t build my confidence in the site | 13 |
| No real impact/no change | 4 |
| Other | 2 |
| Don’t know | 5 |
Q31: What impact, if any, did seeing or reading these privacy policies have upon your attitude towards the site?
Base: Streams 2 and 3, and normally read privacy policy (n=285)
ID fraud and theft
Experience of ID fraud and theft
When this study asked adult Australians if they had ever been the victim of ID fraud or theft, or whether they know someone who has, over one in ten (11%) said that they had been a victim themselves (unchanged from 13% in 2013). However, over one in four (26%) said it had happened to someone they know (up from 17% in 2007 and 21% in 2013). The trend of rising identity fraud is similar to that found in the ABS survey (CAT No. 4528.0). This ABS survey provides some context as to the extent of ID fraud and theft and suggests that it is increasing.
Now over one third (35%) of those surveyed claim to have been either the victim of ID fraud or theft or known someone who has.
Figure 35. Proportion of Australians who have been or know someone who has been the victim of ID fraud and theft

Q38: Have you (or someone you personally know) ever been the victim of identity fraud or theft? (Multi response)
Base: All respondents in stream 1 and 3 (n=1222)
Future concerns of ID fraud and theft
The proportion of Australians concerned about becoming a victim of identity fraud or theft in the next 12 months is stable — over two thirds of Australians expressed concern about the possibility of becoming the victim of ID fraud and theft in the next year (69%), the same proportion as in 2013. In 2007 only 60% had been concerned about becoming a victim of ID fraud and theft, a lower proportion than in the last two surveys.
There has also been no significant change in the level of concern — a fifth of people interviewed in 2017 said they were ‘very concerned’ (21%), not significantly different from the one in four (25%) in 2013.
Figure 36. Proportion of Australians concerned they may become victim of ID fraud and theft in next 12 months
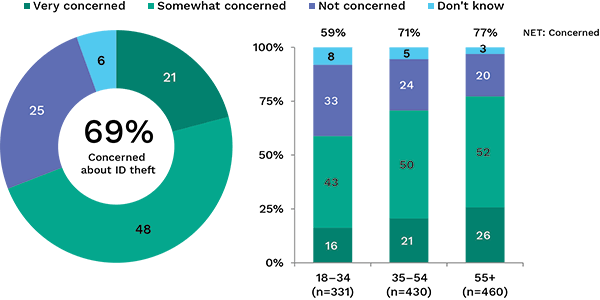
Q39: How concerned are you that you may become a victim of identity fraud or theft in the next 12 months?
Base: All respondents in stream 1 and 3 (n=1222)
Older people were more likely to be ‘very concerned’ about identity fraud or theft — 26% of those aged 55 or over were ‘very concerned’, compared to 16% of those aged 18–34.
Those who had been victims of identity fraud and theft were significantly more likely to be ‘very concerned’ about identity fraud or theft in the next 12 months (34% vs 19% among those who had not been victims).
Credit reporting
Awareness of credit ratings
The majority of people know what a credit rating is (81%), although awareness is significantly lower among those aged 18–34 (65%) than among those aged 35 or over (87%). Those in higher income households are also more likely to be aware of what a credit rating is (87% in households with incomes of $100,000 or over vs 78% in households with lower incomes).
Awareness of credit ratings does not differ significantly by gender, location, or education.
Figure 37. Awareness of credit ratings
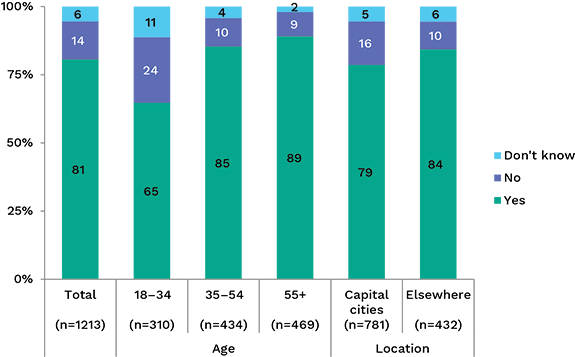
Q40: I’d now like to ask you about credit ratings. Do you know what a credit rating is?
Base: All respondents in stream 2 and 3 (n=1213)
Accessing credit reports
Those aware of what a credit rating is were asked if they had ever tried to get information about their credit rating. Over one in three (38%) had tried to get this information.
Those trying to get information about their credit rating were more likely to be full-time workers (47% vs 32% among the rest of the population). Older Australians were the least likely to have tried to get information about their credit rating (20%). Related to this finding, those aged 55 or over were also significantly less likely to have sought their credit rating (29%) than those aged under 55 (43%).
Figure 38. Getting information about credit rating
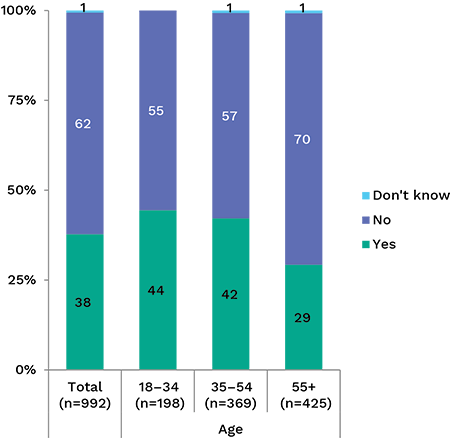
Q41: Have you ever tried to get information about your credit rating? This is called your credit report.
Base: streams 2 and 3 and know what a credit rating is (n=992)
The large majority of people who had not accessed their credit report had not done so because ‘there was no need’ (85%). This proportion was similar across all demographics.
4.0 Methodology
The 2017 ACAPS continues the time series of previous studies conducted in 2013, 2007 and 2001. However, while the scope for the survey continues to be Australians aged over 18 years of age, some of the methodological features of the study have evolved to keep the study up-to-date with current practice, and to ensure it is viable in the future. Most notably, this includes a continued focus on mobile telephone numbers as a sample source (as per 2013 and further expanded) as well as a shift to incorporating more surveys collected via online channels.
Sampling
There were two main components to the survey:
- 800 surveys sourced from random digit dialing (RDD) dual-frame sample
- 1,000 surveys sourced from an opt-in online panel.
The first component was 800 surveys sourced from a dual-frame sample frame of mobile and fixed-line phone numbers. This component was largely comparable with the 2013 survey. The sample was comprised of a set of randomly generated mobile telephone numbers (RDD mobile) and a set of randomly generated fixed-line numbers (RDD fixed). Overall, 80% of the numbers loaded were mobile numbers and the remaining 20 per cent were fixed-line. In 2013, only 30 per cent of the sample was mobile. Including a high proportion of mobile numbers better reflects the usage of telephones in Australia (i.e. the primary phone is usually the mobile) and, with the inclusion of some fixed-line numbers, results in a reasonably representative sample from natural fall-out (i.e. without using quotas to ensure population characteristics in the final sample).
Respondents from this group completed the survey either via Computer Assisted Telephone Interviewing (CATI) or Computer Assisted Web Interviewing (CAWI — often referred to as an ‘online’ interview in this report).
The second component was 1,000 interviews sourced from an online opt-in panel. These surveys allowed the survey to further migrate to an online format, and where the RDD dual-frame sample provided comparisons to the past, one of the benefits of this sample is allowing for future comparisons should the online panel approach be required in the future. The other advantage of the online panel is that it allowed for a significant increase in sample size and modularisation of the questionnaires to cover more content in a shorter questionnaire than was possible in the previous survey in 2013. Quotas were set for the online panel sample to match ABS data for age, sex and location at the national level.
Method
The method in 2017 differed somewhat from 2013, most notably with the inclusion of the online panel and a significant increase in surveys being conducted online. There are some key differences in how people respond to questionnaires online and over the telephone. Given the extensive time-series for this study, the presentation of the CATI questionnaire was kept as consistent as possible. However, when completing questionnaires online respondents are more likely to choose responses such as ‘neither’ or ‘don’t know’ as they can see all responses listed. Presenting ‘do not read’ responses such as ‘don’t know’ on the CATI survey would have limited the ability to monitor real vs methodological changes between 2013 and 2017. Additionally, some open questions which are coded by interviewers do not translate well to online. These were asked as open questions online and manually coded in the data processing stage.
There was also a change in how the SMS notifications were used for the RDD mobile sample. In 2013, respondents who had not responded after a phone call were sent an SMS. The purpose of the SMS was to provide information about who was calling and the reason. In 2017, the SMS was sent to all mobile sample prior to calling, and in addition to providing information about the survey and its purpose, it allowed sample members to log into the survey directly, or go to the Wallis website for more information. This, coupled with the interviewers offering online as an option to people they were speaking with, resulted in one in eight respondents opting to take the survey online rather than over the telephone. This has the benefit of having online response from two sample sources (i.e. RDD mobile and fixed-line vs online panel) which is helpful in determining whether differences in results between groups (and years) are due to mode or sample effects.
Questionnaire development
The questionnaire was developed collaboratively by Wallis and the OAIC. The survey aimed to maintain some time-series data, while also ensuring that the topical issues were included. In 2013, the questionnaire ran for 26 minutes on average, which is too long for a survey being conducted via mobile phone. In order to maintain the required content and reduce the questionnaire length, respondents were randomly allocated to three streams, and combinations of streams (e.g. 1 & 2/1 & 3) were routed through sections of the questionnaire. With the increased sample size, this means the minimum base for any question asked of all respondents was around 1,200.
Pilot survey
On March 7 2017 a pilot survey was conducted with 23 CATI respondents. A core objective of the pilot was to ensure that the overall duration of the questionnaire was successfully reduced through the modularisation of the questionnaire. The average questionnaire length was 20 minutes which was in line with expectations.
Data collection
The main survey ran from 14 March to 3 April 2017, and all CATI interviewing was conducted from Wallis’ facilities in Cremorne in Melbourne. As with the pilot the overall interview length was 20 minutes. Additionally, all data collected via the online survey instrument was managed using Wallis’ in-house systems.
The following tables show the profile of respondents overall and by sample source and mode.
Table 4. Sample composition
| Demographic | Total | Total | RDD | Panel | |||
|---|---|---|---|---|---|---|---|
| CATI | CAWI | CATI | CAWI | CAWI | |||
| Base | 1800 | 698 | 1102 | 698 | 109 | 993 | |
| Age | 18–34 | 475 | 142 | 333 | 142 | 40 | 293 |
| 35–54 | 635 | 233 | 402 | 233 | 39 | 363 | |
| 55+ | 690 | 323 | 367 | 323 | 30 | 337 | |
| Gender | Male | 926 | 374 | 552 | 374 | 51 | 501 |
| Female | 874 | 324 | 550 | 324 | 58 | 592 | |
| Location | Capital cities | 1164 | 455 | 709 | 455 | 65 | 644 |
| Elsewhere | 636 | 243 | 393 | 243 | 44 | 349 | |
| Demographic | Total | Total | RDD | Panel | |||
|---|---|---|---|---|---|---|---|
| CATI | CAWI | CATI | CAWI | CAWI | |||
| Base | 1800 | 698 | 1102 | 698 | 109 | 993 | |
| Age | 18–34 | 26% | 20% | 30% | 20% | 37% | 30% |
| 35–54 | 35% | 33% | 36% | 33% | 36% | 37% | |
| 55+ | 38% | 46% | 33% | 46% | 28% | 34% | |
| Gender | Male | 51% | 54% | 50% | 54% | 47% | 50% |
| Female | 49% | 46% | 50% | 46% | 53% | 50% | |
| Location | Capital cities | 65% | 65% | 64% | 65% | 60% | 65% |
| Elsewhere | 35% | 35% | 36% | 35% | 40% | 35% | |
Weighting
The data were weighted for age, sex, highest level of education, labour force status and location to bring it in line with ABS derived characteristics for Australia. These adjustments were not large, as the sample fell out reasonably in line with the Australian population.
Long text descriptions
Figure 1 — Awareness of the Privacy Commissioner by gender and age
Q6: Were you aware that an Australian Government Privacy Commissioner exists to uphold privacy laws and to investigate complaints concerning the misuse of personal information?
| Response | Total (n=1800) | 18-34 (n=475) | 35-54 (n=635) | 55+ (n=690) |
|---|---|---|---|---|
| Yes | 47 | 41 | 44 | 55 |
| No | 45 | 49 | 46 | 41 |
| Don’t know | 8 | 9 | 10 | 4 |
| Response | Male (n=926) | Female (n=874) | Total (n=1800) |
|---|---|---|---|
| Yes | 50 | 44 | 47 |
| No | 43 | 47 | 45 |
| Don’t know | 6 | 10 | 8 |
Figure 2 — Understanding of entities covered by the Privacy Act
Q6B: Which of the following do you think are under the jurisdiction of the Privacy Act?
| Entity | Yes | No | Don’t know |
|---|---|---|---|
| Multinational organisations operating in Australia | 64 | 16 | 20 |
| Political parties and political representatives | 64 | 17 | 18 |
| Small Australian businesses | 66 | 17 | 17 |
| Media organisations | 69 | 17 | 14 |
| State government agencies | 76 | 13 | 11 |
| Businesses collecting work related information about employees | 77 | 12 | 12 |
| Public schools and Universities | 77 | 11 | 12 |
| Medium to large Australian businesses | 78 | 11 | 12 |
| Federal government agencies | 81 | 10 | 9 |
Figure 3 — Biggest privacy risks facing people today
Q1: What are the biggest privacy risks that face people today in Australia?
| Privacy risk | % of respondents |
|---|---|
| NET: Ways my personal information can be lost | 41 |
| Online services/social media sites | 32 |
| Personal details too easily available/accessible/not secure | 7 |
| Smart phones/apps | 3 |
| ID scanning | 1 |
| How frequently we have to give out personal information | 0 |
| Sending information overseas | 0 |
| Criminal history too easy to access | 0 |
| NET: Risk to me or my information | 43 |
| ID theft/fraud | 19 |
| Data security/data breaches | 17 |
| Financial details/information/fraud | 12 |
| Unauthorized monitoring of information/data mining | 1 |
| NET: Organisations misusing my personal information | 9 |
| Government information sharing/information collection | 4 |
| Commercial interests/marketing about buying habits/profile | 2 |
| Surveillance | 2 |
| Unsolicited phone calls | 2 |
| Workplace privacy | 0 |
| Credit reporting | 0 |
| Other | 10 |
| Don’t know | 14 |
| Total | 1800 |
Figure 4 — Information Australians are most reluctant to provide to businesses and government
Q3: And which ONE of these do you feel MOST RELUCTANT to provide?
| Type of information | % of respondents |
|---|---|
| Financial status | 37 |
| Address | 11 |
| Date of birth | 7 |
| Phone number | 6 |
| All personal information/identification | 4 |
| Photo ID/Information/Passport /Driver’s licence number/Cards and access numbers | 3 |
| Name | 3 |
| Medical or health information | 2 |
| Email address | 2 |
| How many people/men/women in the household | 1 |
| Sexual orientation | 1 |
| Religion | 1 |
| Work status and related information | 0 |
| Buying preferences/spending habits | 0 |
| Marital status | 0 |
| Sexual preferences | 0 |
| Ethnicity | 0 |
| None of these | 7 |
| Refused | 0 |
| Other | 8 |
| Don’t know | 6 |
| Total | 1188 |
Figure 5 — Reasons for reluctance to give key piece of information
Q4: What is your MAIN reason for not wanting to provide?
| Reason | % of respondents |
|---|---|
| Don’t know | 4 |
| Other | 21 |
| I don’t trust them | 1 |
| Discrimination | 2 |
| Unnecessary/irrelevant to their business or cause | 2 |
| I do not want people knowing where I live or how to contact me | 2 |
| I do not want to be identified | 2 |
| Don’t want junk mail/unsolicited mail/SPAM | 3 |
| I don’t want to be bothered/hassled/hounded by phone or door to door | 4 |
| For safety/security/ protection from crime | 13 |
| The information may be misused/information might be passed on without my knowledge | 15 |
| It’s none of their business/privacy | 16 |
| May lead to financial loss/people might access bank account | 17 |
Figure 6 — Australians’ trust in organisations
Q8: How trustworthy or untrustworthy would you say about organisations are with regards to how they protect or use your personal information?
| Organisation type | Very trustworthy (%) | Somewhat trustworthy (%) | Neither (%) | Somewhat untrustworthy (%) | Very untrustworthy (%) | Don’t know (%) | NET: Very Trustworthy / Somewhat trustworthy / Neither (%) |
|---|---|---|---|---|---|---|---|
| Social media industry | 2 | 10 | 10 | 27 | 47 | 5 | 12 |
| eCommerce industry | 2 | 16 | 19 | 31 | 25 | 6 | 19 |
| Debt collectors | 4 | 17 | 16 | 26 | 26 | 11 | 22 |
| Market and social research organisations | 4 | 20 | 17 | 28 | 26 | 5 | 24 |
| Real Estate Agents | 5 | 23 | 18 | 26 | 22 | 5 | 28 |
| Retailers | 4 | 24 | 21 | 29 | 17 | 4 | 28 |
| Organisations providing technology products | 5 | 29 | 17 | 28 | 16 | 5 | 34 |
| Companies in general | 4 | 31 | 24 | 27 | 11 | 5 | 34 |
| Charities | 9 | 29 | 22 | 20 | 14 | 6 | 38 |
| Insurance Companies | 10 | 29 | 17 | 22 | 18 | 4 | 40 |
| Federal Government Departments | 22 | 36 | 13 | 14 | 10 | 5 | 58 |
| State Government Departments | 20 | 38 | 15 | 13 | 10 | 4 | 58 |
| Financial Institutions | 20 | 39 | 12 | 16 | 9 | 3 | 59 |
| Health service providers | 40 | 38 | 10 | 6 | 3 | 2 | 79 |
Figure 7 — Reaction to unsolicited marketing activity
Q33: Which of the following statements BEST DESCRIBES how you GENERALLY feel when organisations that you have NEVER DEALT WITH BEFORE send you unsolicited marketing information?
| Response | % of respondents |
|---|---|
| Don’t know | 3 |
| Other | 0 |
| You don’t mind getting it at all | 1 |
| It doesn’t bother you | 4 |
| It’s a bit annoying but it’s harmless | 7 |
| Concerned about where they obtained it | 43 |
| Annoyed | 42 |
| Total | 1222 |
Figure 8 — Feelings about personal information being sent overseas
Q13: How concerned are you about organisations sending their customers’ personal information from Australia to overseas?
| Response | Total (n=1164) | 18-34 (n=307) | 35-54 (n=406) | 55+ (n=451) |
|---|---|---|---|---|
| Very concerned | 61 | 42 | 61 | 77 |
| Somewhat concerned | 32 | 45 | 33 | 19 |
| Not concerned | 5 | 8 | 4 | 3 |
| Response | Total (n=1164) | Male (n=604) | Female (n=560) |
|---|---|---|---|
| Very concerned | 61 | 58 | 63 |
| Somewhat concerned | 32 | 34 | 30 |
| Not concerned | 5 | 5 | 4 |
| Response | Total (n=1164) | Capital cities (n=746) | Elsewhere (n=418) |
|---|---|---|---|
| Very concerned | 61 | 59 | 65 |
| Somewhat concerned | 32 | 33 | 29 |
| Not concerned | 5 | 5 | 4 |
Figure 9 — Australians’ comfort with businesses sharing personal information with other organisations
Q14B: How comfortable or uncomfortable are you about businesses sharing your personal information with other organisations?
| Response | Total (n=1222) | 18-34 (n=332) | 35-54 (n=430) | 55+ (n=460) |
|---|---|---|---|---|
| Very comfortable | 4 | 3 | 4 | 4 |
| Somewhat comfortable | 7 | 12 | 6 | 2 |
| Neither comfortable nor uncomfortable | 8 | 14 | 7 | 5 |
| Somewhat uncomfortable | 25 | 30 | 26 | 21 |
| Very uncomfortable | 54 | 39 | 56 | 66 |
| Don’t know | 2 | 3 | 2 | 1 |
| Response | Total (n=1222) | Male (n=621) | Female (n=601) |
|---|---|---|---|
| Very comfortable | 4 | 4 | 3 |
| Somewhat comfortable | 7 | 9 | 5 |
| Neither comfortable nor uncomfortable | 8 | 10 | 7 |
| Somewhat uncomfortable | 25 | 26 | 25 |
| Very uncomfortable | 54 | 50 | 58 |
| Don’t know | 2 | 2 | 2 |
| Response | Total (n=1222) | Capital cities (n=800) | Elsewhere (n=422) |
|---|---|---|---|
| Very comfortable | 4 | 3 | 4 |
| Somewhat comfortable | 7 | 7 | 5 |
| Neither comfortable nor uncomfortable | 8 | 8 | 8 |
| Somewhat uncomfortable | 25 | 26 | 25 |
| Very uncomfortable | 54 | 54 | 55 |
| Don’t know | 2 | 2 | 1 |
Figure 10 — Australians’ comfort with government agencies sharing personal information
Q14C: And how comfortable or uncomfortable are you with government agencies sharing information with other government agencies?
| Response | Total (n=1222) | Male (n=621) | Female (n=601) |
|---|---|---|---|
| Very comfortable | 11 | 13 | 9 |
| Somewhat comfortable | 23 | 26 | 20 |
| Neither comfortable nor uncomfortable | 16 | 15 | 16 |
| Somewhat uncomfortable | 23 | 21 | 25 |
| Very uncomfortable | 26 | 23 | 28 |
| Don’t know | 2 | 1 | 3 |
| NET: Comfortable | 33 | 39 | 29 |
| NET: Uncomfortable | 49 | 45 | 53 |
| TOTAL | 1222 | 621 | 601 |
Figure 11 — Australians’ comfort with government using their information for research
Q11B: How comfortable or uncomfortable would you be with the personal information that you’ve provided to government agencies and departments being used for research, service development or policy development purposes?
| Response | Total (n=1164) | 18-34 (n=307) | 35-54 (n=406) | 55+ (n=451) |
|---|---|---|---|---|
| Very comfortable | 12 | 16 | 10 | 11 |
| Somewhat comfortable | 34 | 38 | 33 | 31 |
| Neither comfortable nor uncomfortable | 21 | 24 | 20 | 18 |
| Somewhat uncomfortable | 19 | 15 | 19 | 23 |
| Very uncomfortable | 11 | 4 | 13 | 15 |
| Don’t know | 3 | 3 | 4 | 2 |
| Response | Total (n=1164) | Male (n=604) | Female (n=560) |
|---|---|---|---|
| Very comfortable | 12 | 13 | 11 |
| Somewhat comfortable | 34 | 35 | 32 |
| Neither comfortable nor uncomfortable | 21 | 22 | 20 |
| Somewhat uncomfortable | 19 | 18 | 20 |
| Very uncomfortable | 11 | 8 | 14 |
| Don’t know | 3 | 3 | 3 |
| Response | Total (n=1164) | Capital cities (n=746) | Elsewhere (n=418) |
|---|---|---|---|
| Very comfortable | 12 | 12 | 13 |
| Somewhat comfortable | 34 | 35 | 31 |
| Neither comfortable nor uncomfortable | 21 | 21 | 20 |
| Somewhat uncomfortable | 19 | 19 | 20 |
| Very uncomfortable | 11 | 10 | 13 |
| Don’t know | 3 | 3 | 4 |
Figure 12 — Organisations people would report misuse of personal information to
Q17: If you wanted to report misuse of your personal information to someone, who would you be MOST likely to contact?
| Organisation | % of respondents |
|---|---|
| Don’t know | 47 |
| Other (inc. less than 2% mentions) | 15 |
| Federal/Local/State MP | 2 |
| Search internet /research | 2 |
| Other Government department | 4 |
| The Privacy Commissioner (Federal or State) | 7 |
| Ombudsman | 8 |
| The organisation that was involved | 9 |
| Police | 12 |
| NET: Able to nominate someone to report to | 53 |
Figure 13 — What is a misuse of information?
Q12: Which of the following instances would you regard to be a misuse of your personal information?
| Situation | Yes | No | Don’t know |
|---|---|---|---|
| An organisation sends customer data to an overseas processing centre | 74 | 17 | 9 |
| An organisation asks you for personal information that doesn’t seem relevant to the purpose of the transaction | 81 | 13 | 6 |
| An organisation monitors your activities on the Internet, recording information on the sites you visit without your knowledge | 84 | 10 | 6 |
| You supply your information to an organisation for a specific purpose and they use it for another purpose | 86 | 10 | 5 |
| An organisation reveals a customer’s information to other customers | 87 | 9 | 4 |
| An organisation that you haven’t dealt with gets hold of your personal information | 87 | 9 | 4 |
Figure 14 & 15 — Awareness of the ability to access personal information from government and business
Q15A: Are you aware that you can request to access your personal information from businesses and government agencies?
| Response | Total n=1213 |
|---|---|
| Yes | 37 |
| No | 58 |
| Don’t know | 6 |
| Response | School (n=361) | VET (n=352) | University (n=478) |
|---|---|---|---|
| Yes | 28 | 42 | 45 |
| No | 66 | 54 | 50 |
| Don’t know | 6 | 5 | 5 |
Figure 16 — Support for being informed about loss of personal information
Q14: Think the way that your personal information is handled. Do you agree or disagree?
| Statement | Strongly agree | Somewhat agree | Neither | Somewhat disagree | Strongly disagree | Don’t know |
|---|---|---|---|---|---|---|
| If a government agency loses my personal information they should tell me | 85 | 10 | 2 | 0 | 0 | 2 |
| If a business loses my personal information they should tell me | 82 | 12 | 3 | 1 | 1 | 2 |
Figure 17 — Measures taken by Australians to protect their personal information
Q21: In order to protect your personal information how often do you…?
| Measure taken | Always | Often | Sometimes | Rarely | Never | Don’t know |
|---|---|---|---|---|---|---|
| Provide false personal details | 2 | 6 | 18 | 20 | 51 | 2 |
| Refuse to provide personal information | 5 | 21 | 50 | 15 | 7 | 2 |
| Choose not to deal with an organisation because of concerns regarding privacy | 13 | 23 | 39 | 13 | 8 | 5 |
| Read privacy policies and notifications before providing personal information | 18 | 19 | 30 | 20 | 12 | 2 |
| Ask public or private sector organisations why they need your information | 22 | 21 | 26 | 13 | 14 | 3 |
| Choose not to use an app on a mobile device | 20 | 24 | 27 | 9 | 13 | 7 |
| Clear your browsing and search history | 22 | 25 | 24 | 13 | 12 | 2 |
| Adjust privacy settings on a social networking website | 28 | 20 | 21 | 8 | 15 | 8 |
| Shred documents | 25 | 23 | 17 | 14 | 19 | 2 |
| Check that a website is secure before providing personal information | 36 | 24 | 16 | 8 | 12 | 4 |
Figure 18 — Proportion of Australians who have decided not to deal with an organisation because of concerns over the use of personal information
Q18 / Q19: Have you ever decided NOT TO DEAL with a…?
| Organisation type | Decided not to deal with because of privacy | Have never boycotted because of privacy | Don’t know |
|---|---|---|---|
| Government agency because of concerns over the protection or use of your personal information | 16 | 72 | 12 |
| Private company because of concerns over the protection or use of your personal information | 58 | 31 | 11 |
Figure 19 — Australians’ willingness to give personal information in exchange for a benefit
Q9/Q10/Q11 How likely or unlikely would you be to provide person information to…?
| Benefit type | Very likely | Somewhat likely | Neither | Somewhat unlikely | Very Unlikely | Don’t know |
|---|---|---|---|---|---|---|
| Have a chance to win a prize | 3 | 17 | 18 | 22 | 38 | 3 |
| Receive better customer service | 5 | 26 | 25 | 19 | 21 | 3 |
| Receive rewards and benefits | 6 | 28 | 23 | 18 | 23 | 3 |
Figure 20 — Concern with using biometric data in a number of day-to-day situations
Q37: How concerned are you about using biometric information for you to..?
| Situation | Very concerned | Somewhat concerned | Not concerned | Don’t know |
|---|---|---|---|---|
| Get on a flight | 15 | 28 | 50 | 7 |
| Do your day to day banking | 24 | 32 | 38 | 7 |
| Go into a licensed pub, club, bar or hotel | 30 | 29 | 35 | 7 |
| Get into your place of work or study | 18 | 28 | 46 | 8 |
| Use tech devices (such as a Smartphone or wearable device, such as a fitness tracker) | 20 | 35 | 36 | 9 |
Figure 21 & 22 — Change in levels of concern with the privacy of personal information online compared to five years ago
Q29: Are you more or less concerned about the privacy of your personal information while using the internet than you were five years ago?
| Response | Total (n=1213) | 18-34 (n=310) | 35-54 (n=434) | 55+ (n=469) |
|---|---|---|---|---|
| More | 69 | 65 | 71 | 71 |
| Less | 6 | 11 | 5 | 3 |
| Same | 21 | 20 | 20 | 21 |
| Don’t know | 4 | 5 | 4 | 4 |
| Response | 2017 | 2013 |
|---|---|---|
| More | 69 | 74 |
| Less | 6 | 5 |
| Same | 21 | 18 |
| Don’t know | 4 | 4 |
Figure 23, 24 & 25 — How often products are purchased online
D6: How often do you buy products online?
| Frequency | Total (n=1781) | 18-34 (n=466) | 35-54 (n=627) | 55+ (n=688) |
|---|---|---|---|---|
| At least once a month | 38 | 44 | 47 | 23 |
| Less often than once a month | 46 | 47 | 42 | 48 |
| Never buy products online | 15 | 6 | 10 | 28 |
| Don’t know | 1 | 2 | 1 | 1 |
| Frequency | Total (n=1781) | Less than $25,000 (n=243) | $25-75,000 (n=549) | $75 - 100,000 (n=304) | Over $100,000 (n=410) |
|---|---|---|---|---|---|
| At least once a month | 38 | 27 | 33 | 45 | 57 |
| Less often than once a month | 46 | 46 | 50 | 46 | 37 |
| Never buy products online | 15 | 25 | 17 | 9 | 6 |
| Don’t know | 1 | 2 | - | - | - |
Figure 26 — Perceived risk to privacy dealing with organisations online versus traditional methods
Q29A: Generally speaking, do you believe there are greater privacy risks when dealing with an organisation online compared to traditional settings like going into a branch or on paper?
| Response | Total (n=1312) | 18-34 (n=310) | 35-54 (n=434) | 55+ (n=469) |
|---|---|---|---|---|
| Yes, greater privacy risks online | 83 | 76 | 83 | 90 |
| No, there are not greater privacy risks online | 11 | 16 | 11 | 6 |
| Don’t know | 6 | 8 | 6 | 4 |
| Response | Total (n=1312) | Male (n=627) | Female (n=586) |
|---|---|---|---|
| Yes, greater privacy risks online | 83 | 83 | 84 |
| No, there are not greater privacy risks online | 11 | 14 | 8 |
| Don’t know | 6 | 4 | 8 |
| Response | Total (n=1312) | School (n=361) | VET (n=352) | University (n=478) |
|---|---|---|---|---|
| Yes, greater privacy risks online | 83 | 84 | 85 | 82 |
| No, there are not greater privacy risks online | 11 | 10 | 10 | 14 |
| Don’t know | 6 | 6 | 6 | 4 |
Figure 27 — Perceptions of the proportion of websites that collect information about the people who use them
Q24: Thinking now about using the internet. What proportion of websites do you think collect information about the people who visit them? Would you say it is…
| Response | Total (n=1186) | 18-44 (n=509) | 45+ (n=677) |
|---|---|---|---|
| All | 29 | 35 | 25 |
| Most | 44 | 40 | 48 |
| Some | 14 | 15 | 12 |
| Few | 3 | 3 | 3 |
| None | 1 | 1 | 1 |
| Can’t estimate | 9 | 0 | 12 |
| Don’t use the internet and can’t estimate | 3 | 0 | 5 |
Figure 28 — Proportion of apps that collect information about the people who use them
Q24A: Now thinking about your Smartphone. What proportion of smart phone apps collect information about the people who use them? Do you think it is...
| Response | % of respondents |
|---|---|
| All | 35 |
| Most | 38 |
| Some | 16 |
| Few | 3 |
| None | 1 |
| Have a smartphone but have no idea | 7 |
| Refused | 0 |
Figure 29 & 30 — Level of comfort with search engines and social media sites targeting advertising based on online behaviour
Q25A: Search engines and social media sites targeting advertising at you based on what you have said and done online
| Response | Total (n=1213) |
|---|---|
| Very comfortable | 4 |
| Somewhat comfortable | 17 |
| Neither | 15 |
| Somewhat uncomfortable | 29 |
| Very uncomfortable | 32 |
| Don’t know | 3 |
| Response | Male: 18-34 (n=154) | Male: 35-54 (n=224) | Male: 55+ (n=249) | Female: 18-34 (n=156) | Female: 35-54 (n=210) | Female: 55+ (n=220) |
|---|---|---|---|---|---|---|
| Very comfortable | 5 | 4 | 2 | 6 | 4 | 3 |
| Somewhat comfortable | 34 | 19 | 12 | 19 | 12 | 6 |
| Neither | 15 | 15 | 16 | 17 | 18 | 7 |
| Somewhat uncomfortable | 25 | 25 | 29 | 34 | 36 | 27 |
| Very uncomfortable | 18 | 34 | 40 | 20 | 29 | 50 |
| Don’t know | 3 | 3 | 2 | 3 | 1 | 6 |
Figure 31 — Level of comfort with search engines and social networking keeping databases of online activity
Q25B: Search engines and social media sites keeping databases of information on what you have said and done online
| Response | Total (n=1213) |
|---|---|
| Very comfortable | 4 |
| Somewhat comfortable | 13 |
| Neither | 12 |
| Somewhat uncomfortable | 29 |
| Very uncomfortable | 39 |
| Don’t know | 3 |
Figure 32 — Perception of social networking as a public versus private activity
Q27: Do you think that social networking is ...
| Activity type | 2017 | 2013 |
|---|---|---|
| Mainly a private activity, where users share information with their friends | 28 | 32 |
| Mainly a public activity where users publish information which can be seen by many people | 63 | 60 |
| Don’t know | 8 | 8 |
Figure 33 — Regret relating to material posted on a social networking site
Q26: Have you ever put any information on a social networking site that you’ve later regretted sharing with others?
| Response | Total (n=1213) | 18-34 (n=310) | 35-54 (n=434) | 55+ (n=469) |
|---|---|---|---|---|
| Yes | 25 | 40 | 24 | 12 |
| No | 55 | 49 | 56 | 57 |
| Have never posted information on social networking site | 17 | 6 | 16 | 27 |
| Don’t know | 4 | 4 | 4 | 3 |
Figure 34 — Reading privacy policies
Q30: Do you normally read the privacy policy attached to any internet site?
| Response | % of respondents |
|---|---|
| Yes | 29 |
| No | 65 |
| Don’t know | 6 |
Figure 35 — Proportion of Australians who have been or know someone who has been the victim of ID fraud and theft
Q38: Have you, or someone you personally know, ever been the victim of identity fraud or theft?
| Response | % of respondents |
|---|---|
| Don’t know | 5 |
| No | 60 |
| Yes, it happened to someone I personally know | 26 |
| Yes, it happened to me | 11 |
| NET: Happened to me or someone I know | 35 |
Figure 36 — Proportion of Australians concerned they may become victim of ID fraud and theft in the next 12 months
Q39: How concerned are you that you may become a victim of identity fraud or theft in the next 12 months?
| Response | Total | 18-34 (n=331) | 35-54 (n=430) | 55+ (n=460) |
|---|---|---|---|---|
| Very concerned | 21 | 16 | 21 | 26 |
| Somewhat concerned | 48 | 43 | 50 | 52 |
| Not concerned | 25 | 33 | 24 | 20 |
| Don’t know | 6 | 8 | 5 | 3 |
| Total | 69 | 59 | 71 | 77 |
Figure 37 — Awareness of credit ratings
Q40: Do you know what a credit rating is?
| Response | Total (n=1213) | 18-34 (n=310) | 35-54 (n=434) | 55+ (n=469) |
|---|---|---|---|---|
| Yes | 81 | 65 | 85 | 89 |
| No | 14 | 24 | 10 | 9 |
| Don’t know | 6 | 11 | 4 | 2 |
| Response | Total (n=1213) | Capital cities (n=781) | Elsewhere (n=432) |
|---|---|---|---|
| Yes | 81 | 79 | 84 |
| No | 14 | 16 | 10 |
| Don’t know | 6 | 5 | 6 |
Figure 38 — Getting information about credit ratings
Q41: Have you ever tried to get information about your credit rating? This is called your credit report.
| Response | Total (n=992) | 18-34 (n=198) | 35-54 (n=369) | 55+ (n=425) |
|---|---|---|---|---|
| Yes | 38 | 44 | 42 | 29 |
| No | 62 | 55 | 57 | 70 |
| Don’t know | 1 | - | 1 | 1 |
Footnotes
[1] See The Privacy Act
[2] See Who has responsibilities under the Privacy Act for exemptions
[3] See OAIC Annual Report 2015–16 Table 2
[4] See Data-driven marketing practices Australian industry participants survey results DECEMBER 2016 — Australian Communications and Media Authority
[5] See OAIC Annual Report 2015–16
[6] See APP Guidelines Chapter 12
[7] See Mobile and tablet internet usage exceeds desktop for first time worldwide
[8] See NAB Online Retail Sales Index: Indepth report – December 2016


