-
On this page
Executive summary
Methodology
The Office of the Federal Privacy Commissioner commissioned Roy Morgan Research to investigate community attitudes towards privacy. This was in part a replication of a similar study conducted in 2001. A nation-wide telephone study with a total of 1,507 adults was conducted in May 2004. Three of these questions were verified by re-asking them to a further 1214 respondents. The majority of questions were repeated from the 2001 survey. Respondents interviewed were representative of the adult population nationwide, and results were weighted by age, sex and region using census data.
Community knowledge
Despite a small increase since the 2001 study, levels of knowledge about rights to protect privacy are still low, with only one in four respondents claiming to know an adequate amount or more.
Sixty percent claimed to be aware that federal privacy laws existed, up from 43% in 2001. By contrast, only 34% of respondents were aware that the Federal Privacy Commissioner existed. When asked to whom they would report the misuse of their personal information, 29% said they didn’t know. The remainder mentioned a number of different authorities or organisations, with 7% mentioning the Privacy Commissioner.
Respondents’ level of knowledge about privacy was tested using the following statements. Percentages listed indicate the proportion of respondents who correctly identified each statement as false.
The way government departments or government agencies collect, protect and use people’s personal information is up to the individual departments as they are not bound by any Federal privacy laws or legislation (53%);
Banks, insurance companies and other financial organisations are NOT currently bound by privacy laws which restrict the way they can use their customers’ personal details (56%); and
Charities, private schools, private hospitals and other non-government organisations are free to sell or transfer customer lists containing personal details to other organisations (47%).
Just 23% of respondents correctly identified all three of these statements as false.
Eight in ten respondents (81%) believed customer details held by commercial organisations are often transferred or sold in mailing lists to other businesses.
Interactions with organisations
The vast majority of respondents considered the first four hypothetical situations below to be an invasion of privacy, however the majority did not consider the fifth an invasion:
- a business that you don’t know gets hold of your personal information (94%);
- a business monitors your activities on the internet, recording information on the sites you visit without your knowledge (93%);
- you supply your information to a business for a specific purpose and the business uses it for another purpose (93%);
- a business asks you for personal information that doesn’t seem relevant to the purpose of the transaction (94%); and
- being asked to show identification such as a driver’s license or passport to establish your identity (16%).
Just 11% of respondents stated they were not concerned about supplying any type of personal information to an organisation. Respondents are most reluctant to divulge details about finance (41%) and income (10%). The main reason for being reluctant to provide personal information was because they considered such requests an invasion of privacy rather than from fear of their personal information being misused or causing personal threat.
Fewer respondents in 2004 than in 2001 decided not to deal with a private company (33% in 2004, 42% in 2001) because of concerns over the protection or use of their personal information. The proportion who had decided not to deal with a charity remained consistent across the same time period (15% in 2004, 14% in 2001)
Over 6 in 10 respondents (61%) felt either angry and annoyed, or concerned when they receive unsolicited marketing material. Nineteen percent of respondents agreed that businesses should be allowed to use the electoral roll for marketing purposes, slightly less than the 22% who agreed in 2001. Forty four percent agreed that businesses should be able to use the White Pages for marketing, compared with 42% recorded in 2001. The question about using the White Pages for marketing was repeated to verify results in a context not linked to privacy. In this verification, 29% agreed to using the White Pages for marketing. See Appendix Two for more details.
While the quality of a product or service was rated as the most important element of customer service by respondents, respect for and protection of personal information was rated almost as highly. Twenty seven percent of respondents were willing to provide personal information in return for discounts, while 44% were willing to provide personal details in return for more efficient and personalised service.
Privacy policies are not necessarily being read, partly due to their length and complexity of information. Respondents were asked what aspects of a privacy policy are most important to be included in a summary policy document. How the information will be used was the most frequently nominated response (47%), followed by if and when the organisation will pass on the information (15%) and what information will be kept (15%).
Interactions with government organisations
Just over half (53%) of respondents were in favour of being issued with a unique number to be used for identification when accessing all Australian government services, slightly fewer (41%) were against.
The majority of respondents agreed governments should be allowed to cross reference or share information, but only in some circumstances (62%). One in ten respondents (9%) thought this should happen for any purpose, whereas nearly one in four respondents (24%) thought this should not happen under any circumstance.
To prevent or reduce crime (68%) was the scenario under which most respondents felt it was acceptable to cross reference information, followed by the purpose of updating basic information like address details (58%) and to reduce costs, or improve efficiency (51%).
Health services
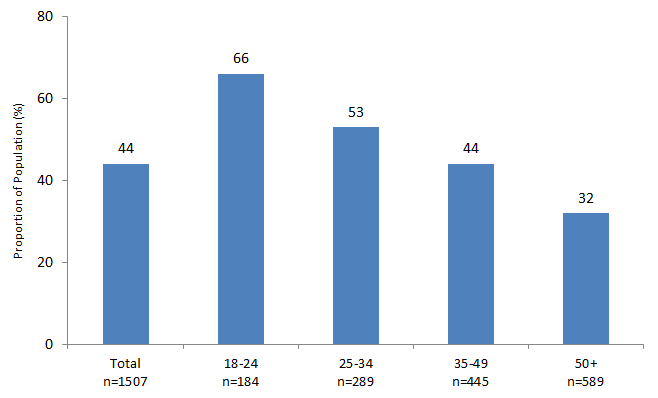
Slightly more than half of respondents (57%) agreed that in order to enable the government to better track the use of health care services, individuals should have a number allocated to them for use when accessing any type of health service. This was higher amongst males (61%) than females (55%), and higher amongst respondents over 50 (62%) and 18-24
(61%), than those aged 25-34 (50%) or 35-49 (55%).
One possible use for such a unique identifier would be to create a national health database which could be accessed by a treating doctor anywhere in Australia. If such a database existed, 64% felt inclusion should be voluntary (cf. 66% in 2001), and 32% believed all medical records should be entered as a matter of course (cf. 28% in 2001). Males were more likely to feel all records should be entered as a matter of course (35%) than females (28%), and respondents over 50 were more likely to feel all records should be entered as a matter of course (37%) than 18-24 year old respondents (25%).
Almost two thirds of respondents (64%) felt permission should be sought before de-identified information is used for research purposes, with one third reporting that permission was not necessary (33%).
Females (68%) were more likely to believe that permission should be sought than males (59%). 18–24 year old respondents (71%) and respondents with lower levels of education were more likely to respond that permission should be sought (73% passed year 10 cf. 56% who have a degree).
Privacy in the workplace
Employers rights were examined over a number of issues, as detailed in the table below.
| Employer Behaviour | Whenever employers choose | Only when they suspect wrong- doing | Not at all | For training and quality control only | Only if necessary to ensure safety |
|---|---|---|---|---|---|
| Reading Work Emails | 23% | 38% | 34% | ||
| Using Surveillance Equipment | 21% | 40% | 35% | ||
| Monitoring What is Typed Into an Employees Computer | 21% | 43% | 32% | ||
| Monitoring Phone Conversations | 5% | 25% | 33% | 35% | |
| Random Drug Testing | 23% | 59% | 16% |
The majority (85%) of respondents thought it was appropriate for employees to have access to their personal files, and (83%) also found it important that employers have a privacy policy which states their organisations views on employee privacy.
Privacy and the internet
When using the internet, 62% of internet users have more concerns about the security of their personal details than usual (cf. 57% in 2001). Consistent with these findings, 67% reported having more concerns now than was the case two years ago.
Two thirds (67%) of respondents who have internet access at home reported that they at some point had read the privacy policy attached to an internet site, up from 55% in 2001. Fourteen percent of those who had read a policy felt more confident and secure about using the site as a result.
Forty one percent of respondents with internet access on their home PC claim to have their web browser currently set to reject cookies, and three in ten respondents admitted to having provided false information when filling out a form online. There were a variety of behaviours used to protect privacy online, including:
- Regularly updating antivirus software (80%);
- Using a firewall (80%);
- Ever having rejected cookies (48%);
- Using a spam filter (47%);
- Using temporary email accounts (38%); and
- Using software to protect anonymity online (28%).
1. Introduction
1.1 Background information
The Office of the Federal Privacy Commissioner (the Office) is an independent statutory body responsible for promoting an Australian culture that respects privacy. The Office currently has responsibilities under the Privacy Act 1988 (Cwlth) (Privacy Act) for the protection of individuals’ personal information.
These responsibilities broadened substantially on 21st December 2001 when the Privacy Amendment (Private Sector) Act 2001 (Cwlth) commenced. The Act extends the Privacy Act 1988 to the private sector, thus requiring many private sector organisations to comply with the National Privacy Principles which set standards for the handling of personal information. In addition, the Office was granted powers of enforcement through a complaints based system, with the power to award compensation to injured parties. During the 2003–2004 financial year, the Office received 1276 complaints, and 20,207 hotline enquiries[1].
In January 2001 the Office commissioned Roy Morgan Research to undertake research into community, business and government agency attitudes towards privacy.
In January 2004, the Office again commissioned Roy Morgan Research to complete another research study, which substantially replicated the 2001 community study. Separate surveys of private sector organisations and government agencies were not included in the 2004 survey. This report details the findings of the 2004 study, and where appropriate, comparisons are made with the results obtained in 2001 and 1994.
1.2 Research objectives
The Office has committed to having a process for evaluating the social impacts of its activities, and to broadly reflect public opinion. This research project is designed to help the Office gauge public opinion. Broadly, the objectives of the survey involved:
- identifying current behaviour of individuals in relation to the privacy of personal information;
- identifying community expectations in relation to privacy practices;
- identify community perceptions and beliefs regarding appropriate levels of privacy protection;
- gauging current levels of knowledge with regards to privacy; and
- gauging current levels of awareness and understanding of the privacy laws and the Office of the Federal Privacy Commissioner.
2. Methodology
2.1 Interviewing
A total of 1,507 CATI (Computer Assisted Telephone Interviewing) interviews were conducted nation-wide in May 2004. In addition, the results obtained for three questions were verified by re-asking these questions to 1214 respondents as a part of Roy Morgan Research’s CATIBUS, a multi-client, shared cost survey. The telephone numbers for both surveys were randomly selected from the latest version of the Electronic White Pages with quotas set according to age, sex and location. Interviews were conducted from Roy Morgan Research offices in Melbourne and Adelaide, with interviewer briefings conducted by Field Managers at each of the sites.
This report deals with the stand-alone telephone survey, referred to as the 2004 Privacy Survey. The CATIBUS Verification project is reported in Appendix Two.
2.2 2004 Privacy survey
Questionnaire design
The questionnaire was designed in close consultation with staff from the Office who, in turn, sought input from a panel of stakeholders. Questionnaire design was aided by the findings from the 2001 study, with the majority of questions repeated from the 2001 study. Whilst many questions were repeats of the 2001 study, their order in the 2004 questionnaire differed. This reordering was to minimise the impact one question may have on the results obtained for subsequent questions. A copy of the 2004 questionnaire is attached at Appendix One.
After finalisation of the draft questionnaire, a pilot phase of ten interviews was conducted to ensure the questionnaire worked well over the phone. Following the pilot, some minor changes were made to the questionnaire, to improve questionnaire flow and respondent comprehension.
The average 2004 interview length was 23 minutes.
Sample design
To ensure the sample adequately represented a true cross-section of the Australian population it was stratified by location (capital cities, other metropolitan and rural) and state.
Age and sex quotas were applied within capital city and non capital city quotas for each state to ensure proportional representation.
The number of interviews conducted within each location is detailed in the following table.
Table 1: Interviews Achieved – Age / Sex by Area
| Age/Sex | Total | Syd | Rest NSW / ACT | Mel | Rest VIC | Bris | Rest QLD | Adel | Rest SA / NT | Perth | Rest WA | TAS |
|---|---|---|---|---|---|---|---|---|---|---|---|---|
| Male 18-24 | 91 | 16 | 13 | 20 | 7 | 10 | 6 | 6 | 1 | 8 | 2 | 2 |
| Male 25-34 | 136 | 30 | 17 | 26 | 8 | 13 | 15 | 7 | 4 | 10 | 3 | 3 |
| Male 35-49 | 223 | 49 | 32 | 40 | 14 | 19 | 22 | 13 | 6 | 17 | 6 | 5 |
| Male 50+ | 283 | 58 | 41 | 48 | 21 | 23 | 31 | 17 | 8 | 22 | 7 | 7 |
| Female 18-24 | 93 | 24 | 9 | 21 | 6 | 8 | 8 | 5 | 1 | 7 | 2 | 2 |
| Female 25-34 | 153 | 38 | 18 | 31 | 8 | 13 | 14 | 8 | 3 | 12 | 4 | 4 |
| Female 35-49 | 222 | 46 | 29 | 40 | 14 | 20 | 25 | 12 | 8 | 17 | 6 | 5 |
| Female 50+ | 306 | 63 | 45 | 55 | 22 | 26 | 32 | 19 | 8 | 21 | 7 | 8 |
| Total | 1507 | 324 | 204 | 281 | 100 | 132 | 153 | 87 | 39 | 114 | 37 | 36 |
Base — All Respondents n=1,507
Auditing and quality control
A total of 200 interviews (13%) were audited by CATI supervisors as part of Roy Morgan Research’s quality control procedures. While two-way ‘live’ auditing (using a CATI system that allows the supervisor to listen in and watch the interview process as it is happening) was undertaken in the Melbourne office, one- way audits were conducted by the Field Manager in the Adelaide Office. (One-way auditing is similar to two-way auditing however the respondent cannot be heard.)
No difficulties or problems with interviewers or the interviewing process were revealed through the auditing process.
Response rates
The following table shows the number of calls made to achieve the 1,507 interviews, along with the number of refusals and terminations.
Table 2: Call results
| Response | Number |
|---|---|
| Interviews achieved | 1,507 |
| Refusals | 8,642 |
|
Terminated mid-interview (respondent drop out) or terminated due to communication difficulty | 1,007 |
|
Quota fail (i.e. no-one in household meets criteria. This would occur towards the end of the survey when many of the age quotas had already been filled) | 1,599 |
| Number called 4 times and no answer or engaged on each occasion | 2,230 |
| Appointments, engaged, no answer (called 1-3 times) | 2,275 |
| Unobtainable (number invalid, fax, data or no longer in use) | 4,475 |
Base — All Respondents n=1,507
Of all households where contact was made with an individual, approximately one in seven completed the interview, hence a response rate of 14%. Given the length of interview, this response rate is acceptable and similar to response rates of other comparable surveys.
The call results which were included in calculating the response rates were:
- Interviews achieved;
- Refusals; and
- Terminated Mid-interview.
There is an increasing trend for more households to refuse to respond to surveys. Invasion of privacy and being too busy are the main reasons given for these refusals. Whilst some surveys require precise, hard measures (and a high response rate), this survey is seeking comparative levels of concern and relationships between highly context dependent ‘soft’ measures. The response rate achieved for this survey is within acceptable industry boundaries for this type of survey.
Attempts to increase the response rate by more intensive follow ups or pre-survey contact would have required a substantially larger injection of public money. It is deemed unnecessary to ascertain measurements of this precision for soft measures.
Weighting of data
The data collected in the survey were weighted according to age, location (including state) and gender characteristics of the wider Australian population with estimates derived from the latest ABS figures.
Unless specifically stated, percentages quoted throughout the report are weighted and refer to estimates relating to the Australian population aged 18 years or over. It should also be noted that percentages have been rounded to the nearest full number and may not, in some instances, add to exactly 100 percent.
2.3 This report
The following report provides a descriptive analysis of each survey question. Results are analysed across a number of relevant variables including age, location, state, education level and income level.
In general, the sampling variation for the sample at the national level for the 2004 Privacy Survey is 1.1% to 2.5%, i.e., there is a 95% probability that the same results within a +/-2.5% range would be obtained.
3. Profile of respondents
Forty-nine percent (733) of interviews were conducted with men and fifty-one percent (774) with women.
The spread of respondents (18 years and over) across the 3 different household income groups is shown in the table below. While quotas were not set on the basis of this variable, a random sampling methodology should have ensured a representative sample across income. While sample figures for the highest income group closely reflect the percentages in the wider population, the lowest income group is somewhat under-represented, the middle income group is slightly over- represented. The ‘can’t say/refused’ category, as in the 2001 study, is heavily over-represented - probably due to the subject matter of the questionnaire (i.e. a heightened sensitivity to giving out personal information). It is often difficult for respondents to estimate household income in the context of a telephone survey, and some respondents confuse pre and post tax income. However, some of the results in this report show a correlation to household income. Where such a correlation exists, please interpret figures with caution.
Table 3: Household Income
Would you mind telling me your household’s TOTAL approximate annual income from all sources, before tax?
| Household Income | % of Sample |
|---|---|
| Less than $50 000 | 22 |
| $50 000-$99 999 | 23 |
| $100 000 or more | 13 |
| Can’t Say / Refused | 42 |
Base — All Respondents n=1,507
Two in three respondents worked in paid employment.
Table 4: Employment Status
Are you now in paid employment?
Is that FULL-time for 35 hours or more a week, or part-time?
| Employment Status | % of Respondents |
|---|---|
| Work Full-Time | 47 |
| Work Part-Time | 20 |
| TOTAL NOW EMPLOYED | 67 |
| Retired | 20 |
| Student | 4 |
| Other Non Worker | 10 |
| TOTAL NOT EMPLOYED | 33 |
| Refused | 0 |
Base — All Respondents n=1,507
Respondents had a wide variety of occupations.
Table 5: Occupation
What is your (last) occupation - the position and industry?
| Occupation | % of Respondents |
|---|---|
| Professional/ Managers/ Owners | 24 |
| Semi-Professional | 9 |
| Sales | 6 |
| Other White Collar | 21 |
| Skilled | 15 |
| Semi/ Skilled Worker | 20 |
| No Occupation | 4 |
Base — All Respondents n=1,507
A wide variety of education levels was also evident.
Table 6: Education
What is the highest level of education you have reached?
| Occupation | % of Respondents |
|---|---|
| Primary School | 1 |
| Some Secondary School | 7 |
| Some Technical Or Commercial | 1 |
| Passed 4th Form/ Year 10 | 15 |
| Passed 5th Form/ Year 11/ Leaving | 9 |
| Finished Technical School, Commercial College Or TAFE | 9 |
| Finished/ Now Studying H.S.C./ V.C.E./ Year 12 | 17 |
| Diploma From C.A.E. | 6 |
| Some University/ C.A.E. | 7 |
| Degree From University Or C.A.E | 27 |
| Other | 1 |
Base — All Respondents n=1,507
The majority of respondents were internet savvy, with 65% reporting that they use the internet at least once a week, and 66% reporting that they have internet access on a home computer.
4. Community knowledge
In order to protect their rights to privacy, consumers must have an understanding of what these rights are. This section examines consumers’:
- knowledge of their rights to protect privacy;
- awareness of privacy laws;
- awareness of the Office of the Federal Privacy Commissioner;
- beliefs as to who they should report a misuse of personal information to; and
- beliefs towards specific laws and behaviours.
4.1 Level of knowledge about rights to protect privacy
Since 2001, respondents report a greater knowledge about their rights to protect their personal information. However levels of knowledge are still low, with only one in four respondents claiming to know an adequate amount or more about their privacy rights as a whole. One group that appears to have better knowledge now than in 2001 is the 18-24 year olds. In the 2001 study, 52% of the younger respondents (18-24) claimed to know very little about their rights to protect their personal information. By 2004, this had reduced to 36%, which is not significantly different to the rest of the population 18+.
Figure 7: Knowledge of Rights to Protect Personal Information
How much would you say you know about your rights when it comes to protecting your personal information?
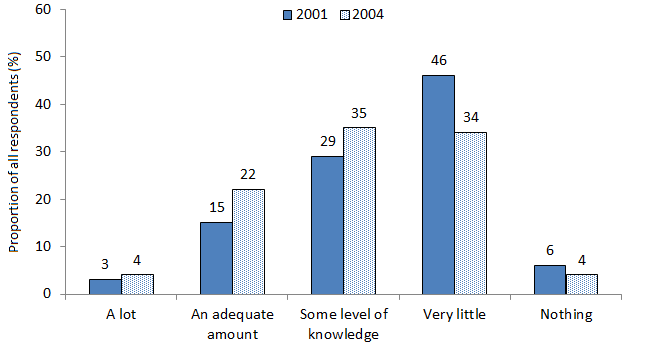
Base – 2001 All Respondents n=1,524, 2004 All Respondents n=1,507
4.2 Awareness of federal privacy laws
Sixty percent of respondents claimed to be aware that Federal privacy laws existed; this is a large increase from both the 2001 study (43%), and the 1994 study (36%). As in 2001, this was higher in city areas, and amongst older respondents. The largest increase in awareness was amongst 18-24 year old respondents where awareness almost doubled from 25% in 2001 to 48% in 2004.
Figure 8: Awareness of Federal Privacy Laws
Currently privacy laws do exist. The laws outline procedures for the collection, use and storage of people’s personal information and apply to Federal government departments and agencies, as well as to health services and many businesses. Were you aware of the PRIVACY LAWS before this interview?
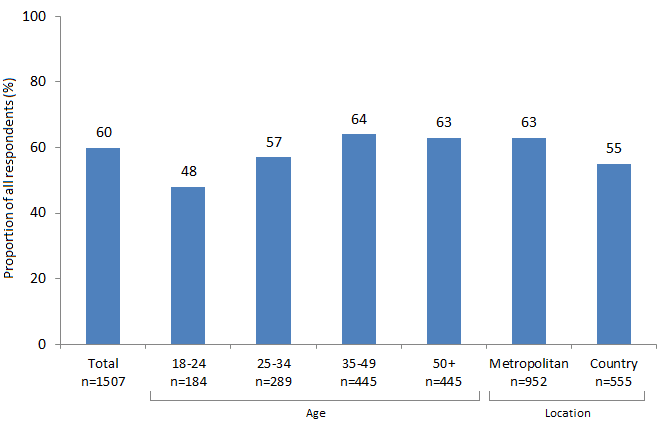
Base – 2004 All Respondents n=1,507
The increase in awareness of privacy legislation occurred in all states of Australia except for Western Australia, which recorded 51% awareness in both 2001 and 2004. In 2001 this was the highest level of awareness across all states and territories, however in 2004 awareness rose in all other states to around 60%, resulting in Western Australia having the lowest awareness of privacy legislation in 2004.
4.3 Awareness of the Federal Privacy Commissioner
Thirty four percent of respondents were aware that the Federal Privacy Commissioner existed, which is similar to 2001 (36%) (this question was measured in a slightly different manner in 2001 to 2004). Awareness was average or higher in New South Wales (39%), Tasmania (36%) and Victoria (34%), and lower than average in South Australia and Northern Territory (26%), Queensland (28%) and Western Australia (31%).
Awareness of the Federal Privacy Commissioner was higher (42%) amongst respondents who were aware of the federal privacy legislation and higher still (53%) amongst respondents who claimed to have a lot or an adequate level of knowledge regarding their rights to protect their personal information. Males had higher levels of awareness (40%) than females (28%), and 18-24 year old respondents had the lowest levels of awareness (26%).
4.4 Reporting misuse of personal information
When asked to whom they would report the misuse of their personal information, 29% said they didn’t know. The remainder mentioned the following authorities or organisations. There has been a steady increase in the proportion of respondents mentioning the Privacy Commissioner, from 2% in 1994, 5% in 2001 up to 7% in 2004. There were no major changes in the types of organisations that respondents were likely to report misuse of personal information to across waves of this study, however reporting a privacy breach to a solicitor was mentioned by 6% of respondents in 2004, down from 13% in 2001 and 11% in 1994.
Figure 9: Reporting Misuse of Personal Information
If you wanted to report the misuse of your personal information, who would you be most likely to contact?
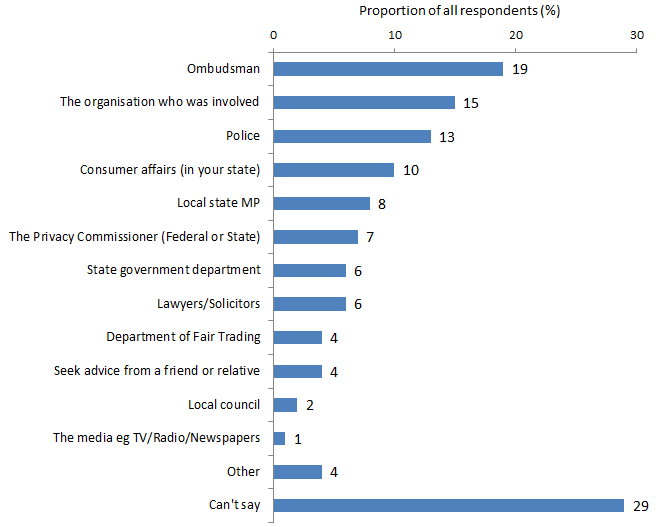
Base – 2004 All Respondents n=1,507
4.5 Beliefs towards specific laws and behaviour
All respondents were asked whether or not they believed customer details held by commercial organisations are often transferred or sold in mailing lists to other businesses. Eight in ten respondents (81%) felt this was true (9% considered it false, 10% could not say). This is similar to the results from the 2001 study (84% true, 7% false, 9% could not say).
There was little variation by state or income level; however younger respondents were less likely to agree than older respondents.
Figure 10: Belief that Customer Details Often Transferred or Sold
Customer details held by commercial organisations are often transferred or sold in mailing lists to other businesses. Would you say this statement was true or false?
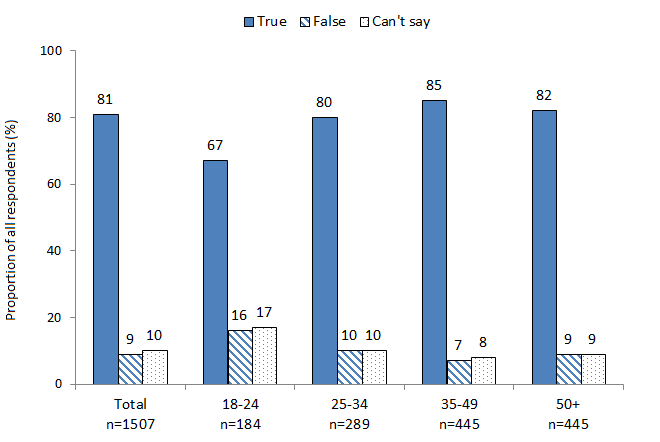
Base – 2004 All Respondents n=1,507
Respondents’ level of knowledge about privacy was tested on the following statements:
The way government departments or government agencies collect, protect and use people’s personal information is up to the individual departments as they are not bound by any Federal privacy laws or legislation;
Banks, insurance companies and other financial organisations are not currently bound by privacy laws which restrict the way they can use their customers’ personal details; and
Charities, private schools, private hospitals and other non-government organisations are free to sell or transfer customer lists containing personal details to other organisations.
All of these statements are false. However it is apparent there is still a great deal of misunderstanding with around half of respondents either incorrectly claiming the statements to be true, or unable to say whether they are true or false.
Figure 11: Respondents’ Level of Knowledge
Would you say this statement was true or false?
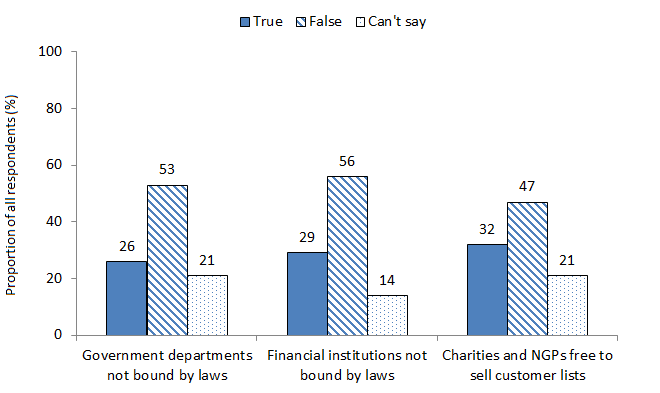
Base – 2004 All Respondents n=1,507
Twenty three percent of respondents correctly identified all three of these statements as false, 6% responded ‘true’ to all three. Those with higher levels of education were more likely to indicate all three statements were false.
For the statement “The way government departments or government agencies collect, protect and use people’s personal information is up to the individual departments as they are not bound by any Federal privacy laws or legislation”, males were more likely to answer this correctly (58%) than females (49%), as were respondents with higher levels of education (70% of respondents with a degree c.f. 34% of respondents with primary school or less than 3 years secondary school education).
For the statement “Banks, insurance companies and other financial organisations are not currently bound by privacy laws which restrict the way they can use their customers’ personal details” respondents with higher levels of education were more likely to answer accurately (66% of respondents with a degree c.f. 46% of respondents with primary school or less than 3 years secondary school education).
For the statement “Charities, private schools, private hospitals and other non- government organisations are free to sell or transfer customer lists containing personal details to other organisations”, once again respondents with higher levels of education were more likely to answer accurately (54% of respondents with a degree cf. 42% of respondents with primary school or less than 3 years secondary school education).
5. Trust in organisations
Respondents were asked to rate how much they trusted the following types of organisations:
- financial organisations;
- real estate agents;
- mail order companies;
- charities;
- government organisations;
- health service providers;
- market research organisations;
- retailers; and
- companies selling over the internet.
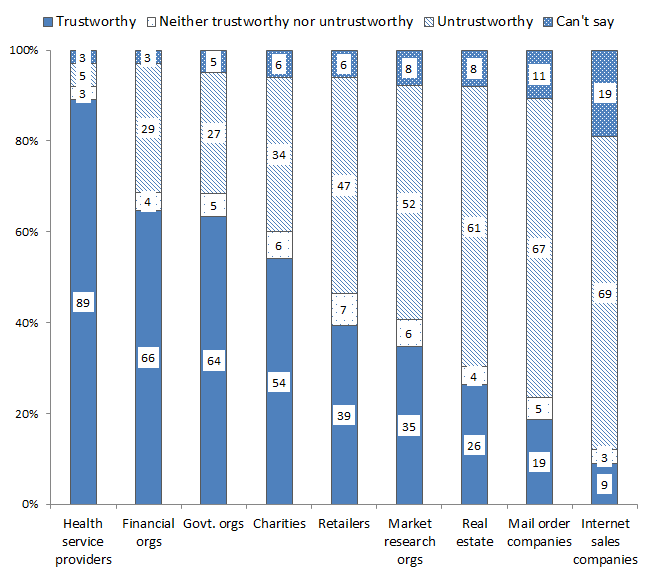
Although the question was worded slightly differently in 1994 than in 2001 and 2004, it appears that levels of trust have increased for:
- health service providers (89% agree in 2004 cf. 84% 2001 and 70% in 1994);
- financial organisations (66% 2004 cf. 59% 2001 and 42% in 1994);
- market research companies (35% in 2004 cf. 32% in 2001 and 29% in 1994);
- government organisations (64% in 2004 cf. 58% 2001);
- retailers (39% in 2004 cf. 35% in 2001); and
- Real estate agents (26% 2004 cf. 20% 2001).
Levels of trust have not changed since 2001 for charities (54%) and internet retailers (9%).
Figure 12: Respondents’ Trust in Organisations
Would you say these types of organisations are trustworthy or untrustworthy when it comes to the protection or use of your personal information?
Base – 2004 All Respondents n=1,507
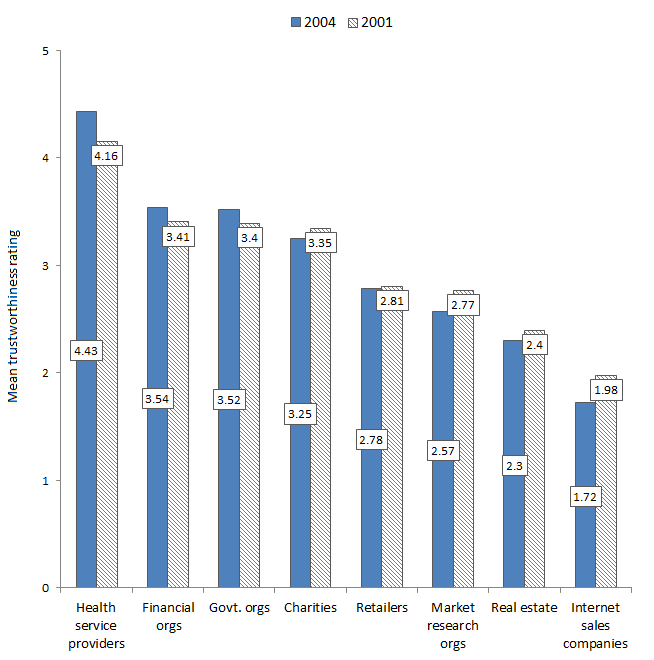
A mean trustworthiness score was created, as shown in the table below.
Table 13: Mean Trustworthiness Score
| Response | Score |
|---|---|
| Highly Trustworthy | 5 |
| Somewhat Trustworthy | 4 |
| Neither Trustworthy nor Untrustworthy | 3 |
| Somewhat Untrustworthy | 2 |
| Highly Untrustworthy | 1 |
| Can’t Say | Not Included |
A mean trustworthiness score captures both the proportion of respondents who find an institution trustworthy and the extent to which they find it trustworthy.
For example, although the proportion of respondents who trust internet sales companies has remained unchanged at 9% since 2001, the mean trustworthiness rating for these companies has dropped from 1.98 to 1.72, due to a larger proportion of the population rating them as highly untrustworthy.
In general, since the 2001 study, there has been little change in mean trustworthiness scores across most of these types of organisations.
Figure 14: Respondents’ Mean Trust in Organisations
Would you say these types of organisations are trustworthy or untrustworthy when it comes to the protection or use of your personal information?
Base – 2001 All Respondents n=1,524, 2004 All Respondents n=1,507
6. Interactions with organisations
6.1 Concerns over providing personal information
A number of hypothetical situations were tested in terms of whether they are considered to be an invasion of privacy.
The scenarios tested are:
- a business that you don’t know gets hold of your personal information;
- a business monitors your activities on the internet, recording information on the sites you visit without your knowledge;
- you supply your information to a business for a specific purpose and the business uses it for another purpose;
- a business asks you for personal information that doesn’t seem relevant to the purpose of the transaction; and
- being asked to show identification such as a driver’s license or passport to establish your identity. (This scenario was measured in a slightly different manner to the other scenarios. This scenario was not measured in 2001.)
The vast majority of respondents regarded each of the first four scenarios to be an invasion of privacy, however being asked to show identification as evidence of identity is not considered an invasion of privacy.
Figure 15: Respondents’ Perceptions of Invasion of Privacy
Would you say this was an invasion of the privacy of your personal information?
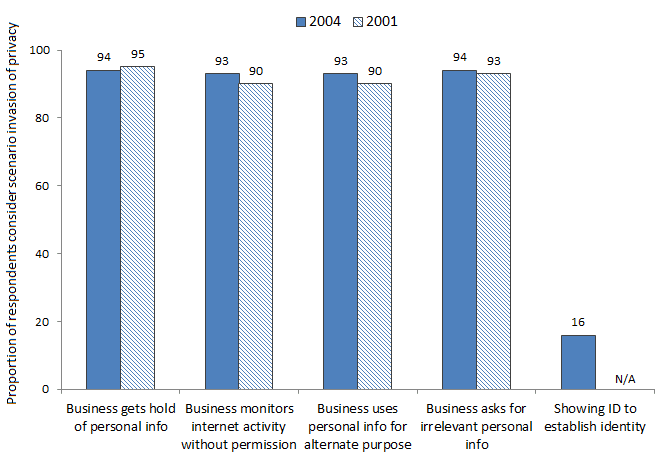
Base – 2001 All Respondents n=1,524, 2004 All Respondents n=1,507
Being asked to show identification was measured through the two questions “Over the last two years, would you say the number of times you have been asked to show identification such as a drivers license or passport to establish your identity has increased, decreased or stayed about the same?” and “Do you consider such demands to be an invasion of privacy?”. This was not measured in 2001.
There was little variation by age, sex, level of knowledge or education to any of these scenarios.
Respondents were asked if the incidence of being asked to show identification to establish identity is more, less or about the same as two years ago, with thirty eight percent reporting an increase. The majority (56%) claimed it was about the same, 4% claimed a decrease and 2% couldn’t say.
Younger respondents (18-24 years old) were more likely than other age groups to report an increase in incidence in requests for identification over the past two years. Keep in mind that two years ago, this age group was 16-22 years of age.
As young people become independent and assume more responsibility, they may have to interact with a greater number and variety of organisations (such as telephone and electricity companies, superannuation funds managers, the Roads and Traffic Authority etc.). This increase in the number of interactions may account for the increase in requests for identification this age group has reported over the last two years.
6.2 Reluctance to provide personal information
As was the case in 2001, there is a degree of reluctance by most of the community to provide some types of personal information. Only 11% stated they were not concerned about supplying any type of information. The types of personal information respondents identified they were reluctant to provide did not differ substantially between the two studies. Finance and income continue to be the details respondents are reluctant to divulge, however home contact details remain relatively high.
Table 16: Types of Information Reluctant to Provide
When providing your personal information to any organisation, IN GENERAL, what types of information do you feel RELUCTANT to provide? For example, your name, address, phone number, financial details, income, marital status, date of birth, email address, medical information, genetic information, or something else?
| Type of information | 2001 (n=1,524) % | 2004 (n=1,507) % |
|---|---|---|
| Financial details, such as bank accounts | 59 | 58 |
| Details about your income | 42 | 34 |
| Home phone number | 17 | 22 |
| Medical history / health information | 25 | 21 |
| Home address | 14 | 20 |
| Email address | 11 | 19 |
| Genetic information | 13 | 11 |
| Marital status | 9 | 9 |
| Date of birth | 7 | 8 |
| Name | 6 | 7 |
| Religion | 2 | 3 |
| How many people or males in household / Family member details | 1 | 2 |
| None | 16 | 11 |
Respondents were asked which type of information they would be most reluctant to provide. Financial and income details remain as being those respondents are most reluctant to divulge.
Table 17: Types of Information Most Reluctant to Provide
And of [those mentioned] which ONE of these do you feel MOST RELUCTANT to provide?
| Type of information | 2001 (n=1,306) % | 2004 (n=1,294) % |
|---|---|---|
| Financial details, such as bank accounts | 40 | 41 |
| Details about your income | 11 | 10 |
| Home phone number | 3 | 5 |
| Medical history / Health information | 7 | 5 |
| Home address | 4 | 7 |
| Genetic information | 3 | 2 |
The information types can be grouped into Finance and Income (financial details and details about your income) and Contact Details (home phone number, home address, name and email address). We can compare the reasons why respondents felt reluctant to provide information across these subgroups.
Reasons for being reluctant to provide personal information varied. However for the majority the main reason given was a general comment about invasion of privacy rather than fears about a specific type of misuse or personal threat. However, since the 2001 study, there has been an increase in concern about protection from crime, and being sent unsolicited advertising material. Respondents most concerned about divulging financial and income details thought it was an invasion of privacy generally, or they had concerns it may be used to commit a crime against them. Those concerned about handing over contact details were primarily concerned with the risk of receiving unsolicited mail, thought it was irrelevant to the organisation or generally were not happy with people knowing where they lived.
Respondents 18-24 years of age were less concerned about providing financial details (30%) than respondents 35-49 (42%) or 50+ (45%), however the 18-24 year old age group were more concerned about providing contact details such as a home address (18%) or email address (7%) than respondent 35-49 (6% and 5% respectively) or 50+ (4% and 3% respectively).
Table 18: Reason reluctant to provide information
And what is your MAIN reason for not wanting to provide this type of information?
| Reason Reluctant to Provide Personal Information | 2001 (n=1,306) % | 2004 (n=1,294) % | Finance and Income (n=756) % | Contact Details (n=278) % |
|---|---|---|---|---|
| It’s None of Their Business / Invasion of Privacy | 51 | 44 | 54 | 16 |
| The Information May Be Misused | 12 | 8 | 8 | 7 |
| May Lead to Financial Loss / People Might Access Bank Account | 7 | 8 | 13 | 0 |
| For Safety / Security / Protection (From Crime) | 2 | 6 | 8 | 5 |
| Unnecessary / Irrelevant to Their Business or Cause | 2 | 5 | 1 | 19 |
| I Don’t Want to Be Bothered/ Hassled / Hounded (by Phone / Door to Door) | 1 | 5 | 5 | 2 |
| Don’t Want Junk Mail / Unsolicited Mail / Spam | 1 | 5 | 1 | 20 |
| I Do Not Want People Knowing Where I Live/ How to Contact Me | 6 | 5 | 1 | 18 |
| Information Might Be Passed on Without my Knowledge | 5 | 3 | 3 | 5 |
| Discrimination | 4 | 3 | 2 | 1 |
| I Do Not Want to Be Identified | 3 | 1 | 0 | 2 |
| Other | 3 | 3 | 3 | 3 |
| Can’t Say | 4 | 2 | 1 | 1 |
Base – 2001 n=1,306, 2004 n=1,294, Finance and Income n=756, Contact Details n=278
6.3 Protection and use of personal information
People appear to be engaging in more behaviours to protect their privacy since the 2001 study. Leaving personal information off forms as a means of protecting their personal information was reported by more respondents in 2004 than in 2001.
Figure 19: Frequency Leave Information Off Forms
When completing forms or applications that ask for personal details, such as your name, contact details, income, marital status etc, how often, if ever, would you say YOU LEAVE SOME QUESTIONS BLANK as a means of protecting your personal information?
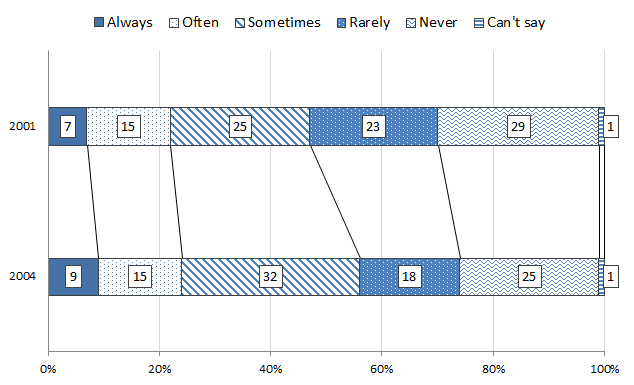
Base – 2001 All Respondents n=1,524, 2004 All Respondents n=1,507
A score can be assigned to each response to calculate a mean score. Analysis of this mean score shows that female respondents, respondents aged 25-49, and respondents with a household income over $100,000 are more likely to leave information off forms than the rest of the adult population.
Table 20: Mean Score Calculation
| Response | Score |
|---|---|
| Always | 5 |
| Often | 4 |
| Sometimes | 3 |
| Rarely | 2 |
| Never | 1 |
| Can’t Say | Not Included |
Figure 21: Mean Frequency Leave Information Off Forms
When completing forms or applications that ask for personal details, such as your name, contact details, income, marital status etc, how often, if ever, would you say YOU LEAVE SOME QUESTIONS BLANK as a means of protecting your personal information?
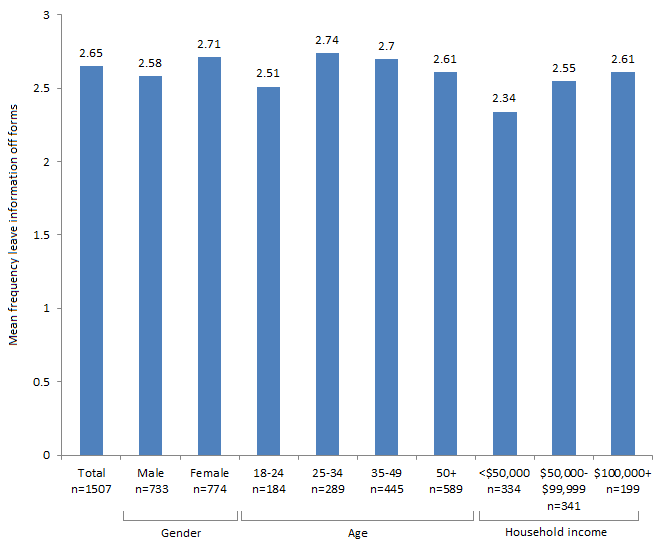
Base – 2001 All Respondents n=1,524, 2004 All Respondents n=1,507
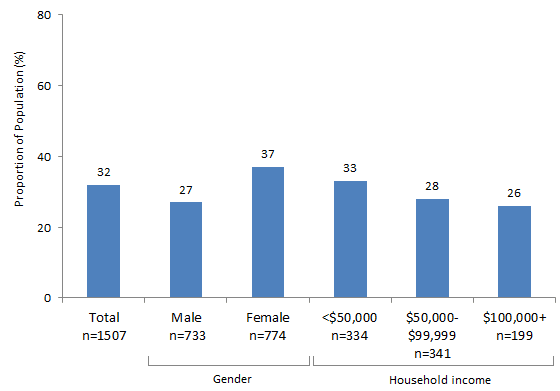
All respondents were asked if they have ever decided not to deal with a private company or charity, or a government organisation or agency because of concerns over the protection or use of their personal information. Fewer respondents reported deciding not to deal with a private company or charity in 2004 than in 2001.
Figure 22: Decided Not to Deal with an Organisation to Protect Personal Information
Firstly, have you ever decided NOT TO DEAL with a .... because of concerns over the protection or use of your personal information?
- PRIVATE COMPANY or CHARITY
- GOVERNMENT ORGANISATION or AGENCY
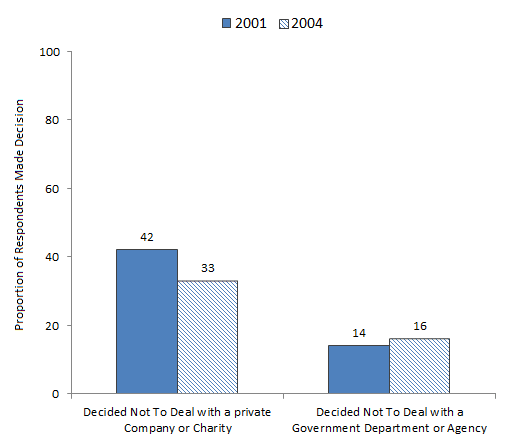
Base – 2001 All Respondents n=1,524, 2004 All Respondents n=1,507
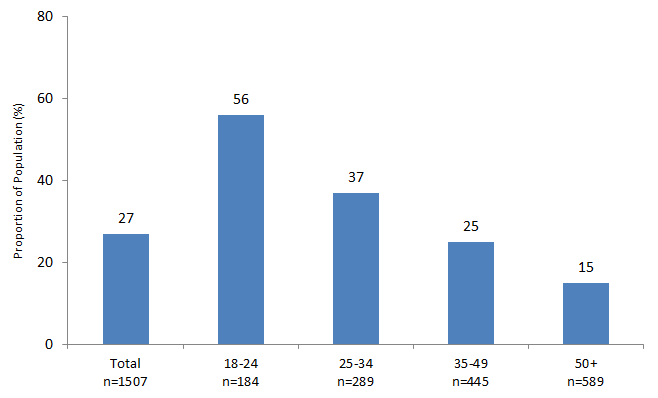
This showed some variation with age, with 25-49 year old respondents being more likely to have decided not to deal with an organisation.
Respondents with a degree were more likely to have decided not to deal with a private company or charity (40%) than respondents who left school after year ten or the equivalent (32%). This was not the case for deciding not to deal with government department or agency, where those with a degree were marginally less likely (15%) to have made this decision than respondents with who left school after year ten (18%).
Respondents from Western Australia (41%) and New South Wales (35%) were the most likely to have decided not to deal with a private company or charity, whereas respondents from Queensland (28%) and South Australia (28%) were the least likely. Western Australian (18%) and Victorian (18%) respondents were the most likely to have decided not to deal with a government department, with respondents from Queensland (13%) and Tasmania (14%) being the least likely.
Figure 23: Decided Not to Deal With an Organisation by Age
Firstly, have you ever decided NOT TO DEAL with a .... because of concerns over the protection or use of your personal information?
- PRIVATE COMPANY or CHARITY
- GOVERNMENT ORGANISATION or AGENCY
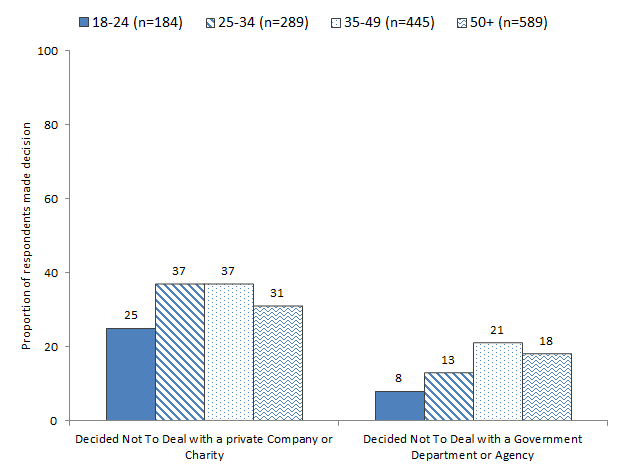
Base – 2001 All Respondents n=1,524, 2004 All Respondents n=1,507
6.4 Attitudes towards marketing material
Some organisations use personal information to send highly targeted, personalised marketing material. Respondents’ reactions to such marketing material were examined.
Although concerns about unsolicited marketing material have dropped slightly since the 2001 study, 6 in 10 respondents (61%) felt either angry and annoyed, or concerned when they receive such information (respondents were permitted to give multiple answers to this question, 8% felt both angry and annoyed and concerned about where their personal information was obtained).
Figure 24: Reactions to Unsolicited Marketing Material
Which of the following statements BEST DESCRIBE how you GENERALLY feel when organisations that you have NEVER DEALT WITH BEFORE send you unsolicited marketing information?
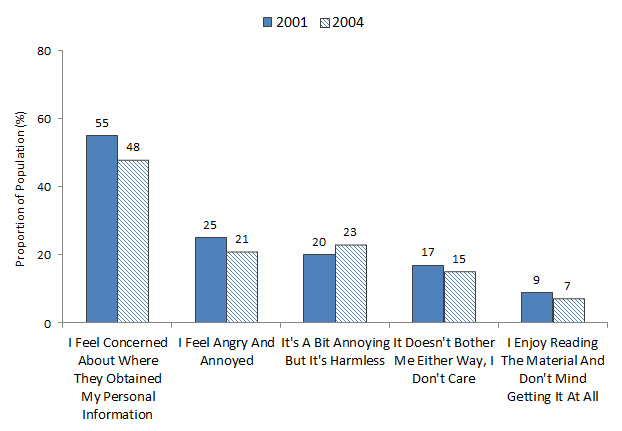
Base – 2001 All Respondents n=1,524, 2004 All Respondents n=1,507
Respondents were asked the extent to which they agreed or disagreed that businesses should be able to access the electoral roll and the White Pages for the purposes of marketing.
The question regarding the White Pages was one of the three questions verified on the verification survey, shown in Appendix Two. While the majority of respondents were against using the electoral roll for marketing, they were divided as to whether or not marketing should be allowed using data from the White Pages. However, the proportion against using the White Pages for marketing was slightly higher in the verification study, please refer to Appendix Two for more details.
Figure 25: Reactions to Businesses Using the Electoral Roll or White Pages for Marketing
Do you agree or disagree that businesses should be able to use the ... for marketing purposes?
- electoral roll
- White Pages
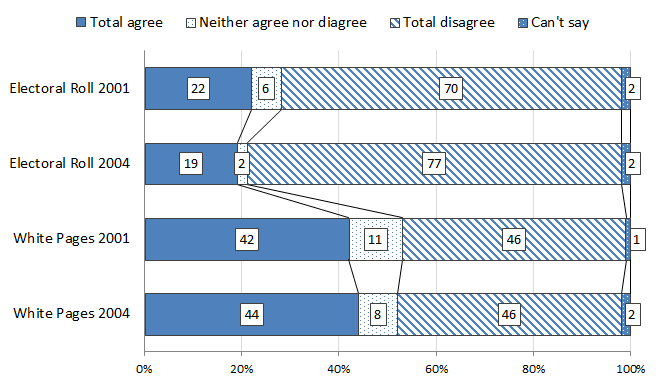
Base – 2001 All Respondents n=1,524, 2004 All Respondents n=1,507
There were some differences amongst sub-groups examined:
- 18-24 year old respondents were more likely to agree that businesses should be able to use the electoral roll (22%) than 35-49 year old respondents (17%) or respondents over 50 (19%).
- males were more likely to agree (47%) to businesses using the White Pages for marketing than females (40%)
- those with a degree were more likely to agree (49%) to businesses using the White Pages for marketing than those who left school after year 10 (41%)
- respondents in paid employment were more likely to agree (47%) to businesses using the White Pages for marketing than those not working (36%).
6.5 Trade off between customer service and privacy
Often, organisations access the personal information of their customers in order to improve the customer service they can provide. For example, an individual who travels frequently may prefer to use a certain brand of hotel. If they arrive in a city they have never visited before, and stay in a hotel owned by this chain, there are several elements of customer service that would impress many patrons, such as:
- the ability to charge the bill to a centralised account;
- the patron’s preferred newspaper being delivered in the morning;
- knowing what kind of car they have and the registration number for valet purposes; and
- that the patron prefers a non-smoking room.
However, in order to provide this personalised level of service, the hotel would need to keep a customer database containing all this information, which is accessible worldwide. This section of the report examines the importance of various aspects of customer service to individuals, and their likelihood of trading elements of their right to privacy in order to receive such services.
Importance of aspects of customer service and privacy
Respondents were asked to rate the following five service aspects according to importance:
- respect for, and protection of, personal information;
- quality of product or service;
- efficiency of service;
- price; and
- convenience.
While the quality of product or service was rated as most important to respondents, respect for and protection of personal information was rated almost as highly by respondents. However, this statistic may be inflated by the context in which it was measured. Respondents were aware that the research was being carried out on behalf of the Office, and had been asked several questions relating to personal information before this question was asked.
Table 26: Importance of Aspects of Customer Service
When dealing with businesses that require your personal information, which of the following aspects of customer service are most important to you? Please rank them starting with the MOST important and finishing with the LEAST important
| Customer Service Element | Rated 1st 2001 (%) | Rated 1st 2004 (%) | Rated 1st or 2nd 2004 (%) | Rated 1st, 2nd or 3rd 2004 (%) |
|---|---|---|---|---|
| Quality of Product or Service | 34 | 35 | 64 | 80 |
|
Respect for and Protection of Personal Information | 36 | 32 | 47 | 61 |
| Price | 8 | 13 | 33 | 57 |
| Efficiency of Service | 11 | 12 | 32 | 54 |
| Convenience | 6 | 5 | 13 | 28 |
| Can’t Say | 5 | 3 | 3 | 3 |
Base – 2001 All Respondents n=1,524, 2004 All Respondents n=1,507
Respect for, and protection of personal information was more likely to be rated most important by women (37%) than men (27%), and by those with lower household incomes (<$50,000 33%, $50,000-99,999 28%, $100,000+ 26%).
Figure 27: Importance of Respect and Protection of Personal Information
When dealing with businesses that require your personal information, which of the following aspects of customer service are most important to you? Proportion rated importance of respect and protection of personal information as most important.
Likelihood of giving personal information in exchange for discount
The relatively low importance of price in comparison to the importance of having their personal information adequately protected (as shown in the previous question) is further reinforced with only one quarter of respondents (28%) saying they would be likely to provide personal information in return for discounted goods or services. Over half (55%) were unwilling to trade personal information for discounts, 5% were neither likely nor unlikely and 11% said it depended on the organisation involved.
Younger people were far more likely than those from older age groups to provide their personal information in return for discounts; however no distinct pattern emerged across different household income ranges.
Figure 28: Provide Personal Information for Discount
GENERALLY, how likely or unlikely would you be to provide your personal information to an organisation if it meant you would receive discounted purchases? Proportion likely to provide personal information for discount.
Likelihood of giving personal information in exchange for personalised service
While only 27% were willing to provide personal information in return for discounts, 44% were willing to provide personal details in return for more efficient and personalised service. Nearly the same proportion (41%) stated they were not willing to trade personal information in exchange for personalised service, 4% were neither likely nor unlikely and 9% said it depended on the organisation.
This varied by age, with younger respondents being far more likely to exchange personal information for improved service than older respondents.
Figure 29: Provide Personal Information for Service
GENERALLY, how likely or unlikely would you be to provide your personal information to an organisation if it meant you would receive more efficient and personalised service? Proportion likely to provide personal information for more efficient and personalised service.
There has been some variation in these metrics between the 2001 and the 2004 studies. In 2004, although respondents appear less willing to trade their privacy for discounts (55% unlikely in 2004 cf. 48% unlikely in 2001), there is no change in the proportion likely or unlikely to provide more personal information for better levels of service.
Figure 30: Provide Personal Information for Discount or Service
GENERALLY, how likely or unlikely would you be to provide your personal information to an organisation if it meant you would receive...
- discounted purchases?
- more efficient and personalised service?
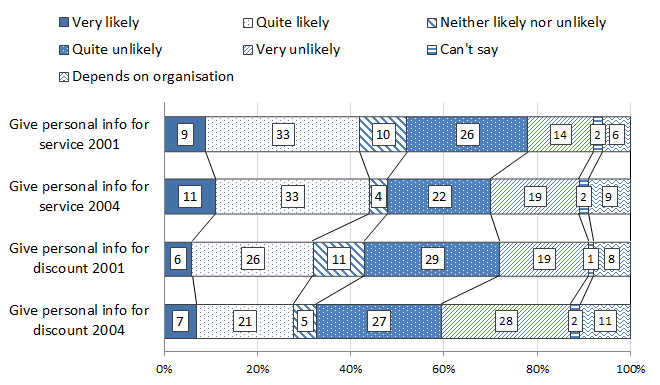
Base – 2001 All Respondents n=1,524, 2004 All Respondents n=1,507
6.6 Attitudes towards privacy policies
Research suggests that people are not necessarily reading privacy notices due to their length and complexity of information[2]. One option for encouraging people to read privacy notices is to make them shorter.
Respondents were asked what aspects of a privacy policy are most important to be included in a summary. The response most nominated was “how the information will be used”.
Table 31: Most Important Elements of a Privacy Policy
Many organisations have a publicly available privacy policy. If there was a requirement that all privacy policies have a one page summary, in terms of the personal information the company has, which ONE of the following do you think is MOST IMPORTANT to be in this summary?
And which would be SECOND most important?
And which would be THIRD most important?
| Privacy Policy Element | Most Important (%) | Two Most Important (%) | Three Most Important (%) |
|---|---|---|---|
| How the information will be used | 47 | 71 | 84 |
|
If and when the organisation will pass on my information | 15 | 37 | 60 |
| What information will be kept | 15 | 37 | 57 |
|
How to prevent being contacted for marketing purposes | 12 | 24 | 42 |
| How to access or change my information | 6 | 20 | 38 |
| Can’t say | 4 | 4 | 4 |
Base – 2001 All Respondents n=1,524, 2004 All Respondents n=1,507
7. Government departments and privacy
The technology exists for government departments to share information about their customers. This could allow departments to function more efficiently, as basic details like address and telephone numbers could automatically be updated across all departments once one department is informed of a change. This could also allow government departments to provide more personalised service.
This may involve the use of a unique identifier each time a customer accesses a government department. Community attitudes towards such an identifier are examined in this section.
Respondents were asked whether they were in favour or against being issued with a unique number to be used for identification purposes and also to access government services on the internet.
While just over half (53%) of respondents were in favour of this concept, (41%) were against the concept. Males were more likely to agree (56%) than females (50%), and respondents on higher household incomes were more likely to agree than those on lower incomes. This question was verified by the CATIBUS, and the results were very similar, as can be seen in Appendix Two.
Figure 32: Attitudes Towards a Unique Identifier for All Australian Government Departments
It has been suggested that each Australian should be given a unique number, like a tax file number, to be used for identification in ALL Commonwealth Government Departments, and to access government services on the Internet. In principle, are you in favour or against each Australian being given such a number?
Respondents were then asked under what circumstances government departments should be allowed to cross reference or share information. The majority of respondents agreed government departments should be able to do this, but only in some circumstances. One in ten respondents (9%) thought this should happen for any purpose, whereas nearly one in four respondents (24%) thought this should not happen under any circumstance.
Males were more likely than females to believe this should happen under any circumstance (11% cf. 8%), and respondents with household incomes below $50,000 were more likely to say information should not be cross referenced at all (27%) than those with household incomes of $50,000-$99,999 (18%) or over $100,000 (17%). Respondents over 50 years (13%) were more likely to believe this should happen under any circumstance than respondents aged 18-24 (4%). Conversely, respondents over 50 were less likely to believe this should happen under some circumstances (56%) than respondents aged 18-24 (65%).
Figure 33: Circumstances Under Which Government Departments Should be Able to Share Information
Do you believe government departments should be able to cross-reference or share information in their databases for any purpose, some purposes, or not at all?
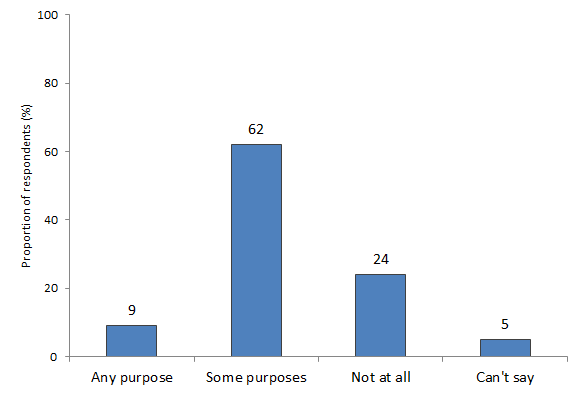
Base – 2004 All Respondents n=1,507
Those respondents who answered “some purposes” were given three hypothetical situations (respondents who answered “any purpose” were assumed to agree to all three hypothetical situations).
“To prevent or reduce crime” was the scenario under which more respondents felt it was acceptable to cross reference information. Respondents on higher household incomes were more likely to agree to information being cross referenced for all three purposes.
Figure 34: Purposes for Which Government Departments Should be Able to Share Information
For which of the following purposes do you believe governments should be allowed to cross reference information? For updating basic information like address details? To solve or prevent fraud or other crime? To reduce costs, or improve efficiency?
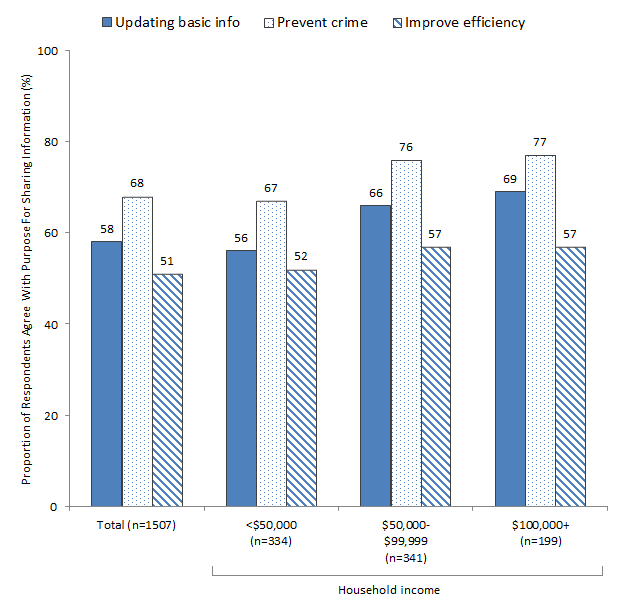
Base – 2004 All Respondents n=1,507
8. Health services and privacy
This section examines community views of health professionals discussing patient details without consent, as well as the concept and usage of a unique identifier within the health system, a national health database and the use of de-identified health information by organisations.
8.1 Health professionals discussing patient information amongst themselves without patient permission
Since the 2001 study, respondents appear to have become slightly more comfortable with the idea of a doctor discussing their personal medical details with other health professionals, in a way which identified them, if the doctor thought it would lead to a better health outcome for the patient.
Figure 35: Attitudes Towards Doctors Discussing Patient Details With Other Health Professionals
Do you agree or disagree with the following statements? Your doctor should be able to discuss your personal medical details with other health professionals - in a way that identified you - WITHOUT YOUR CONSENT if they thought this would assist your treatment?
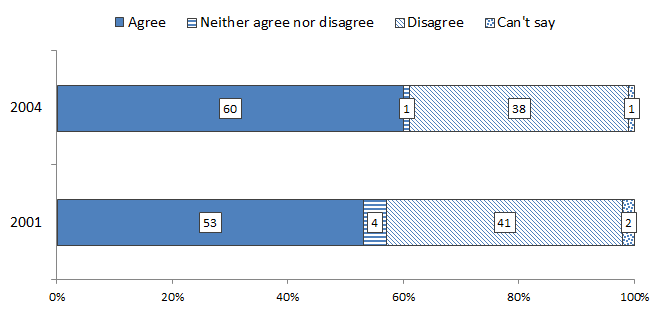
Base – 2001 All Respondents n=1,524, 2004 All Respondents n=1,507
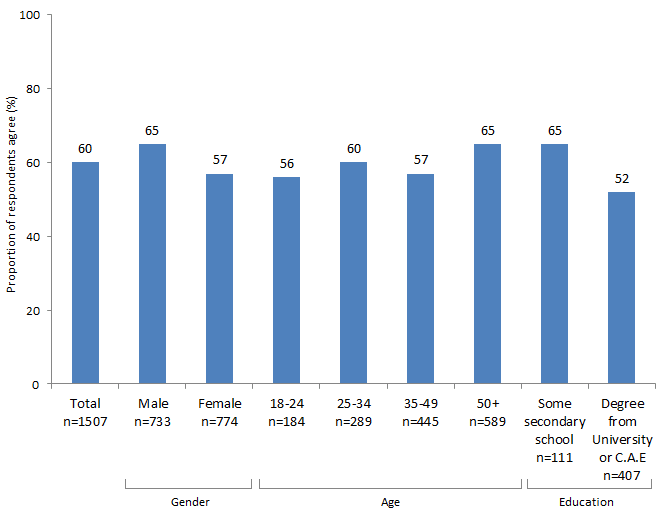
Males were more likely to agree to this statement than females, older respondents were more likely to agree than younger respondents, and those with lower levels of education were more likely to agree than those with higher levels of education.
Figure 36: Attitudes Towards Doctors Discussing Patient Details With Other Health Professionals
Do you agree or disagree with the following statements? Your doctor should be able to discuss your personal medical details with other health professionals - in a way that identified you - WITHOUT YOUR CONSENT if they thought this would assist your treatment?
8.2 Attitudes to a health number
In a similar manner to the last section (Section 7), respondents’ views about being allocated a number which they must use to access all health services were examined. In order to minimise any contextual bias, this section was asked in the survey prior to the section about an identifier to access all Australian Government departments.
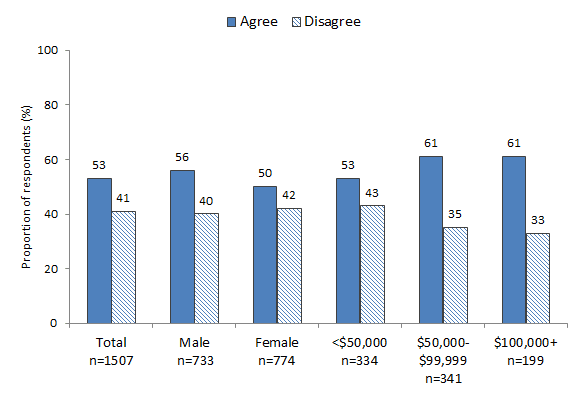
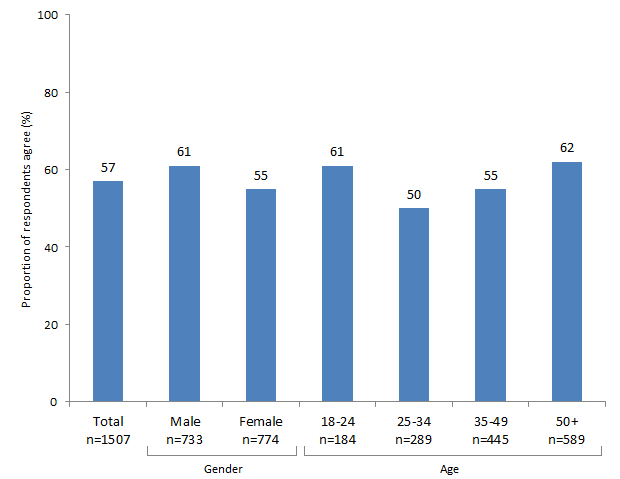
In order to enable the government to better track the use of health care services, the majority of respondents (57%) agreed (including 28% who strongly agreed) that individuals should have a number allocated to them for use when accessing any type of health service. Thirty six percent disagreed with this concept and 4% were undecided. This is slightly higher than the proportion of respondents who agreed that all Australians should be given a unique number to use when accessing all Australian Government services (53%).
Males were more likely to agree to this statement than females, and respondents 18-24 years of age, or over 50 were more likely to agree than the rest of the sample.
Figure 37: Attitudes Towards A Health Number
Do you agree or disagree with the following statements? To enable the government to better track the use of HEALTH SERVICES, all individuals should be allocated a NUMBER and that number should be used when accessing ANY health service or facility.
8.3 Inclusion in a national health database
One possible use for such an identifier would be to create a national health database. This database could be accessed by a treating doctor anywhere in Australia, increasing the health outcomes for each patient involved. Additionally, such a network could be used for the creation of national health statistics, allowing governing bodies the ability to better plan and use national health resources.
If such a database existed, 64% felt inclusion should be voluntary (cf. 66% in 2001), and 32% believed all medical records should be entered as a matter of course (cf. 28% in 2001).
Some differences amongst sub-groups were evident:
- Males were more likely to feel all records should be entered as a matter of course (35%) than females (28%); and
- Respondents over 50 were more likely to feel all records should be entered as a matter of course (37%) than 18-24 year old respondents (25%).
The results to this question were also validated in the CATIBUS. Results across both surveys were very similar, as is shown in Appendix Two.
8.4 Permission sought for use of de-identified health information for research purposes
De-identified health information can be very valuable to private companies, such as pharmaceutical companies, as well as to government bodies. Respondents were asked whether they felt that an individual’s permission should be sought before such de-identified information derived from personal information about them is used for research purposes.
Almost two thirds of respondents (64%) felt permission should be sought, with one third reporting that permission was not necessary (33%).
Females were more likely to answer that permission should be sought (68%) than males (59%). 18–24 year old respondents were the most likely age group to believe permission should be sought (71%), and respondents with lower levels of education were more likely to respond that permission should be sought (73% passed year 10 cf. 56% who have a degree).
9. Privacy in the workplace
The increased availability of technology has enabled employers to gain greater access into the activities of employees. This section examines respondents’ views about a variety of workplace privacy issues.
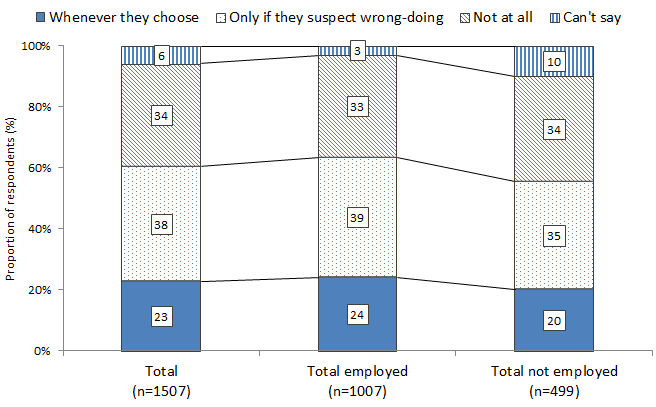
9.1 Employers reading work emails
Respondent views were polarised on this issue, with roughly one quarter (23%) responding that employers should be able to read emails sent to their employees’ work accounts whenever they choose, and one third (34%) feeling that employers should not have this right.
The belief that employers should be able to read employees’ email whenever they choose was more likely to be held by:
- males (26%) than females (19%);
- respondents in paid employment (24%) than those not in paid employment (20%); and
- respondents over 35 years (25%) compared to 18-34 year old respondents (16%).
Figure 38: Attitudes Towards Employers Reading Emails Sent To Employees’ Work Email Accounts
For each of the following, could you tell me if you think it’s appropriate behaviour for an employer to do whenever they choose, only if they suspect wrong-doing or not at all. Read e-mails sent to a work email account.
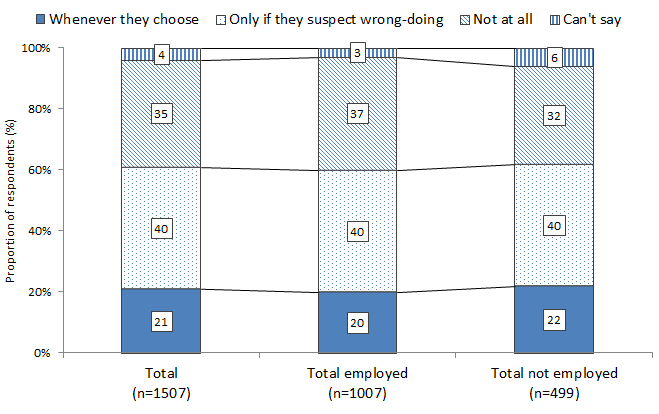
9.2 Use of surveillance equipment
The views respondents held towards the use of surveillance equipment were very similar to those expressed regarding work emails. Respondents 18 – 24 years old were more likely to believe this was appropriate for an employer to do whenever they choose (35% whenever they choose, 35% only if they suspect wrong-doing, 30% not at all) than any other age group.
Respondents who held a degree were far less sympathetic to employers using surveillance equipment, with only 13% expressing that this was an appropriate action whenever an employer chose (39% only if they suspect wrongdoing, 43% not at all).
Figure 39: Attitudes Towards Employers Using Surveillance Equipment to Monitor the Workplace
For each of the following, could you tell me if you think it’s appropriate behaviour for an employer to do whenever they choose, only if they suspect wrong-doing or not at all. Use surveillance equipment such as video and audio cameras to monitor the workplace.
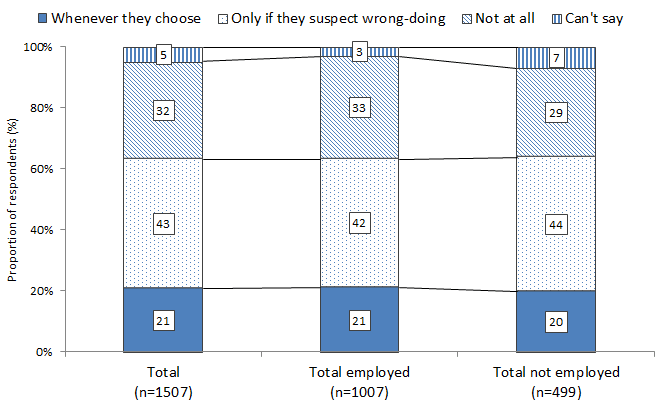
9.3 Monitoring what is typed into an employee’s computer
Respondents did not feel any more strongly about employers monitoring what is typed into a work computer than reading emails or using surveillance equipment. Males were more likely to find this behaviour appropriate whenever an employer chooses (24% whenever they choose, 39% when suspect wrong doing, 33% not at all) than females (17% whenever they choose, 47% when suspect wrong doing, 30% not at all). Respondents aged 18-24 were the least likely sub-group to find this type of behaviour appropriate (14% whenever they choose, 45% when suspect wrong doing, 40% not at all).
Figure 40: Attitudes Towards Employers Monitoring What Is Typed Into An Employee’s Computer
For each of the following, could you tell me if you think it’s appropriate behaviour for an employer to do whenever they choose, only if they suspect wrong-doing or not at all. Monitor everything an employee types into their computer, including what web sites they visit and what they type into emails.
9.4 Monitoring employees’ telephone conversations
Respondents are more concerned about employers monitoring phone conversations than the other kinds of employer behaviour measured. Monitoring phone conversations had the lowest proportion of respondents (5%) accepting this as appropriate employer behaviour for an employer whenever they chose.
Respondents were given the additional option of stating whether this was appropriate for training and quality control purposes. This option was seen as acceptable by one third (33%) of respondents, a further 25% felt this was acceptable if the employer suspected wrongdoing, and 35% felt it was not acceptable at all.
Figure 41: Attitudes Towards Employers Monitoring Employees’ Telephone Conversations
Listen to telephone conversations...Do you feel this is appropriate behaviour for an employer to do whenever they choose, FOR TRAINING AND QUALITY CONTROL, only if they suspect wrong-doing or not at all?
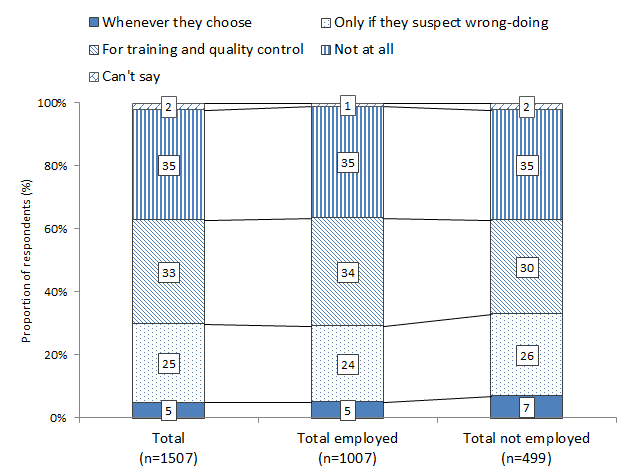
There was little variation amongst most of the subgroups examined, however respondents with a degree were more likely to feel this was appropriate for training and quality control (39% for training and quality control, 19% only if they suspect wrong-doing), than respondents who had completed year 10, who were more likely to feel it was appropriate if an employer suspected wrong-doing (24% for training and quality control, 30% only if they suspect wrong-doing).
9.5 Random drug testing
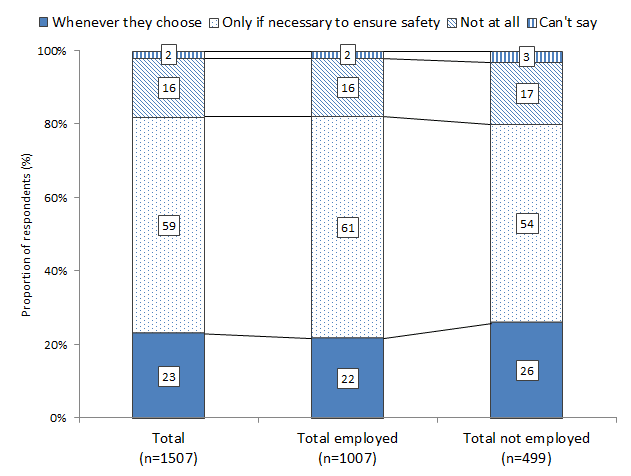
The majority of respondents (59%) saw this as appropriate only when necessary to ensure safety. This was more likely to be seen as appropriate behaviour for an employer to do whenever they choose by males (26%) than females (20%).
Respondents with year ten as their highest level of education were the most likely subgroup to see this behaviour as appropriate whenever an employer chooses (31% cf. those who have a degree 16%).
Figure 42: Attitudes Towards Random Drug Testing of Employees
Randomly drug test employees...Do you feel this is appropriate behaviour for an employer to do whenever they choose, ONLY IF NECESSARY TO ENSURE SAFETY, or not at all
9.6 Employees access to their personal employer files
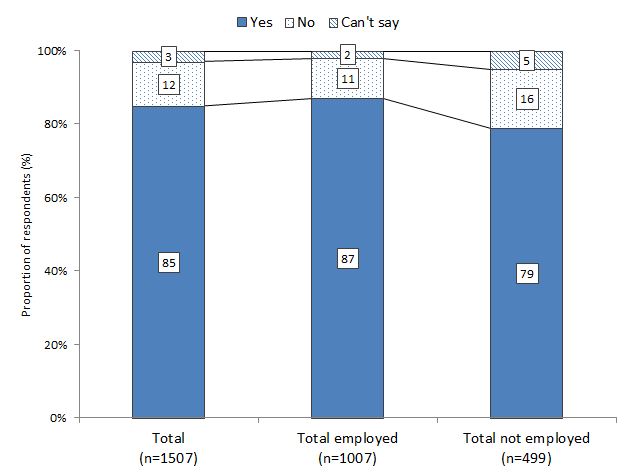
All respondents were asked whether they thought it was appropriate for employees to have access to their personal files. The majority (85%) thought this was the case. Male respondents were more likely to hold this view (87%) than female respondents (83%). And almost nine in ten 18-24 year old respondents (89%) felt this was appropriate compared to eight in ten (81%) of respondents over 50.
Eighty seven per cent of those employed thought it was appropriate to be granted this access, with 79% of non-workers holding the same view.
Figure 43: Attitudes Towards Employees Having Access to Their Personal Employer Files
Do you think that employees should have access to the information their employer holds about them?
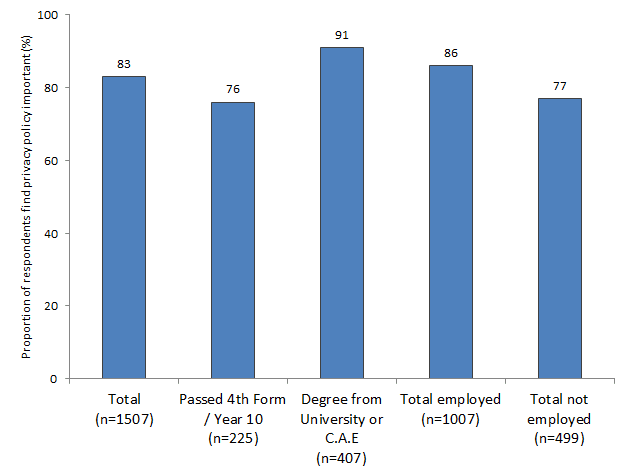
9.7 Importance of employers providing a privacy policy
All respondents were asked how important it was that employers have a privacy policy which states how they manage employee privacy. The majority (83%) found this important. Over half of respondents (51%) found this very important, with a further third (32%) stating that it was quite important (9% not very important, 4% not at all important).
Respondents with a degree were more likely to find this important, as were respondents currently employed.
Figure 44: Total Proportion of Respondents Find Employer Privacy Policy Important
How important is it to you that an employer has a privacy policy that covers when they will read employee emails, randomly drug test employees, use surveillance equipment to monitor employees and listen to telephone conversations?
10. Privacy on the internet
The growth in internet usage, both in the workplace and for personal use has seen a rise in the risks to privacy online. Cookies, viruses and software which tracks and monitors internet activity are now commonplace hazards when using the internet. This section examines respondents’ feelings of security when using the internet, and provides an indication of the measures respondents are taking to protect their privacy online.
10.1 Usage
Sixty five percent of respondents reported using the internet once a week or more often. This is up from 51% in 2001. The internet is more likely to be used by males (69% cf. 61% females) younger respondents (82% of 18-24 year old respondents cf. 48% of respondents aged over 50), those with higher levels of education (84% of respondents with a degree cf. 42% who left school after year 10), and amongst respondents who work (78% cf. 40% of non workers).
Two thirds of respondents reported having internet access at home.
10.2 Attitudes towards privacy on the internet
Six in ten respondents (62%) have more concerns about the security of their personal details than usual when using the internet. This level of concern has risen since the 2001 study.
The level of concern was similar across all subgroups.
Figure 45: Concerns Over the Security of Personal Details Online
GENERALLY, when dealing over the internet, would you say you have MORE CONCERNS about the security of your personal details than usual, FEWER concerns or about the same?
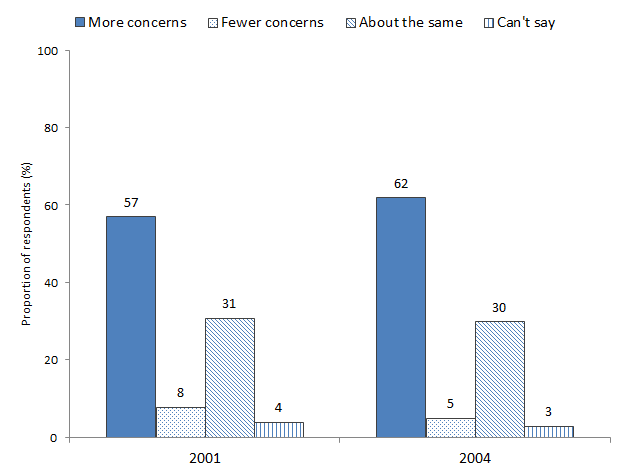
Consistent with these changes in concern over time, two in three (67%) respondents reported having more concerns now than two years ago (7% less concerned, 23% about the same).
10.3 Privacy policies online
Two thirds (67%) of respondents reported that they at some point had read the privacy policy attached to an internet site. This is an increase from 55% in 2001.
Respondents who claimed to have a lot or an adequate amount of knowledge about how to protect their privacy were more likely to have read a privacy policy online (74%). Interestingly, respondents who claim to have more concerns about the security of their personal information online were no more likely (68%) to have read a privacy policy than those with fewer concerns, or about the same level of concern (66% and 67% respectively).
Those who have read a privacy policy were asked what impact this had on their attitude towards the website. Although it remains the most commonly reported impact, feeling more confident and secure about using the site was only reported by 14% of respondents (cf. 18% in 2001).
Table 46: Impact of Reading a Privacy Policy on Perception of an Internet Site
What impact, if any, did seeing or reading these privacy policies have upon your attitude towards the site?
| Impact | 2001 n=780 (%) | 2004 n=983 (%) |
|---|---|---|
| Feel more confident/ Comfortable/ Secure about using the site | 18 | 14 |
| Made me more cautious/ Aware when using the internet generally | 4 | 6 |
| Still apprehensive about sites that have them/ don’t trust them/ Not convinced | 2 | 5 |
| Helps me decide whether to use the site or not | 1 | 4 |
| It’s a good idea/ I approve of the privacy policy/ They are doing the right thing/ Prefer to see it on sites | 6 | 4 |
| Too long/ Too complicated to read | 2 | 4 |
| Appear more honest/Trustworthy/Responsible/ Legitimate | 3 | 3 |
| Other | 10 | 2 |
| Can’t say | 5 | 3 |
| None/ No impact | 54 | 26 |
10.4 General online behaviours to protect privacy
There are several things consumers can do to protect their privacy online. This section examines the behaviour of respondents online to protect their privacy.
Setting web browser to reject cookies
Rejecting cookies was measured in two ways in the 2004 study, those who have ever rejected cookies, and those who currently have their web browser set to reject cookies. Forty eight percent of respondents claim that they have ever rejected cookies. This is higher than the 41% of respondents who currently have their web browser set to reject cookies (29% not set, 31% unsure or don’t know what cookies are). This is a large increase from the 2001 study, where 27% had their browser set to reject cookies (38% not set, 34% unsure or don’t know what cookies are).
Males were more likely to have their browser set to reject cookies (43%) than females (38%), and respondents with more concerns about the security of their personal information online were marginally more likely to reject cookies (43%) than average (41%).
Providing false information when filling out online forms
Three in ten respondents admitted to having providing false information when filling out a form online. Younger respondents were far more likely to have behaved in this manner, with 53% of 18-24 year old respondents saying they did this (cf. 40% of 25-34 year olds, 25% of 35-49 year olds and 14% of respondents
over 50).
10.5 Home PC security
There are a number of measures that a PC owner can take to protect their privacy online. While more than 80% regularly update antivirus software, less than half of respondents took any other measures to protect their privacy on their home PC.
Figure 47: Measures Taken to Protect Home PC
Which of the following do you currently have on your home computer?
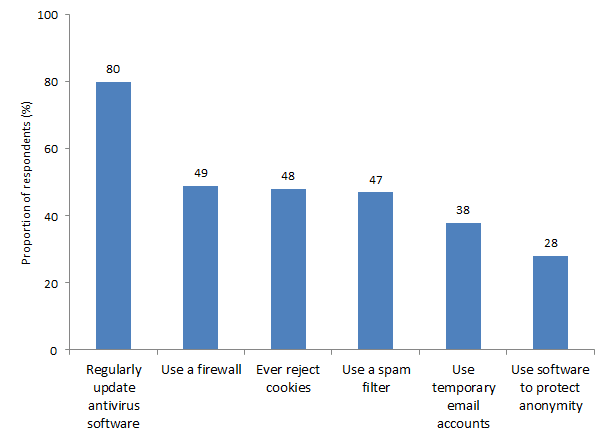
Base — 2004 Total have home computer n=1,001
The following trends were evident in the data:
Using a firewall
- Those with a degree were more likely (55%) to use a firewall than those who finished high school after year 10; and
- Those in paid employment were more likely (51%) than those not working (44%).
Rejecting cookies
- Males were more likely to reject cookies (55%) than females (40%);
- Those with a degree were more likely to reject cookies (53%) than those who finished high school after year 10 (30%); and
- Those with a household income of over $100,000 were more likely to reject cookies (55%) than those with a household income under $100,000 (45%).
Using a spam filter
- 18 to 34 year old respondents were more likely to use a spam filter (51%) than respondents over 35 (44%);
- Those with a degree were more likely (56%) than those who finished high school after year 10 (25%);
- Those with a household income of over $50,000 were more likely (50%) than those with a household income under $50,000 (43%); and
- Those in paid employment were more likely (49%) than those not working (42%).
Using temporary email accounts
- Those with a household income under $50,000 were more likely (46%) to use temporary email accounts than those with a household income over $50,000 (37%);
- Respondents from Tasmania (51%) and Western Australia (50%) were more likely to use temporary email accounts than respondents from South Australia including Northern Territory (33%), Queensland (36%), New South Wales (37%) or Victoria (38%) ; and
- Younger respondents were more likely than older respondents (18-24 67%, 25-34 40%, 35-49 36% and 50+ 26%).
Appendix one — the questionnaire
Good [Morning/ Afternoon/ Evening], my name is (SAY NAME) from Roy Morgan Research, the people who conduct the Morgan Gallup poll. Today we are conducting an important survey on behalf of a Federal government agency on the protection and use of people’s personal information by businesses and other organisations. All views are of interest to us and results may be used to help better protect consumers’ privacy in the future. Your answers will be strictly confidential and used as statistics only.
To ensure we speak to a representative sample of the population, we would like to speak with the youngest male in the household aged 18 years or over.
Answering our questions will only take about 15 minutes.
IF NOT A CONVENIENT TIME NOW MAKE APPOINTMENT
IF ASKS HOW DID YOU GET MY NUMBER, SAY: Your number was selected randomly from the white pages phone book.
IF RESPONDENT WANTS FURTHER INFORMATION, SAY: If you’d like more information about the survey or wish to check the validity of the research you may contact XXXX XXXX from the Office of the Privacy Commissioner. His number is XX XXXX XXXX, during business hours.
QSEX. RECORD SEX OF RESPONDENT
- 1 MALE
- 2 FEMALE
QAGE. Before we begin, to ensure we are interviewing a true cross-section of people, would you mind telling me which of the following age groups you belong to? READ OUT
- 1 18-24
- 2 25-29
- 3 30-34
- 4 35-44
- 5 45-49
- 6 50-54
- 7 55-64
- 8 65+
- 9 (DON’T READ) REFUSED
[Single]
Q2. Firstly, have you ever decided NOT TO DEAL with a PRIVATE COMPANY or CHARITY because of concerns over the protection or use of your personal information?
- 1 YES
- 2 NO
- 3 CAN’T SAY
[Single]
Q2A. Have you ever decided NOT TO DEAL with a GOVERNMENT ORGANISATION or AGENCY because of concerns over the protection or use of your personal information?
- 1 YES
- 2 NO
- 3 CAN’T SAY
[Single]
Q1. When completing forms or applications that ask for personal details, such as your name, contact details, income, marital status etc, how often, if ever, would you say YOU LEAVE SOME QUESTIONS BLANK as a means of protecting your personal information? Would that be #/Always, Often, Sometimes, Rarely or Never/ Never, Rarely, Sometimes, Often or Always/?
- 1 ALWAYS
- 2 OFTEN
- 3 SOMETIMES
- 4 RARELY
- 5 NEVER
- 6 CAN’T SAY
[Multiple]
Q3. When providing your personal information to any organisation, IN GENERAL, what types of information do you feel RELUCTANT to provide? For example, your name, address, phone number, financial details, income, marital status, date of birth, email address, medical information, genetic information, or something else? What else?
HIGHLIGHT ALL MENTIONED.
- 1 NAME
- 2 HOME ADDRESS
- 3 HOME PHONE NUMBER
- 4 FINANCIAL DETAILS, SUCH AS BANK ACCOUNTS
- 5 DETAILS ABOUT YOUR INCOME
- 6 MARITAL STATUS
- 7 DATE OF BIRTH
- 8 EMAIL ADDRESS
- 9 MEDICAL HISTORY/ HEALTH INFORMATION
- 10 GENETIC INFORMATION
- 11 RELIGION
- 12 HOW MANY PEOPLE OR MALES IN HOUSEHOLD/ FAMILY MEMBER DETAILS
- 97 Openend OTHER (SPECIFY)
- 98 Single CAN’T SAY/ IT DEPENDS
- 99 Single NONE
IF MORE THAN ONE RESPONSE ON Q3, ASK:
ONLY ANSWERS GIVEN IN Q3 WILL BE INCLUDED IN Q4.
[Single]
Q4. And of [%DQ3] which ONE of these do you feel MOST RELUCTANT to provide?
INTERVIEWER NOTE: IF ONLY ONE TYPE OF INFORMATION IS DISPLAYED (IE FROM CODE 97 ON Q3), OPEN “OTHER” AND TYPE IN SAME RESPONSE.
IF OTHER, HIGHLIGHT OTHER AND TYPE IN RESPONSE
- 1 NAME
- 2 HOME ADDRESS
- 3 HOME PHONE NUMBER
- 4 FINANCIAL DETAILS, SUCH AS BANK ACCOUNTS
- 5 DETAILS ABOUT YOUR INCOME
- 6 MARITAL STATUS
- 7 DATE OF BIRTH
- 8 EMAIL ADDRESS
- 9 MEDICAL HISTORY/ HEALTH INFORMATION
- 10 GENETIC INFORMATION
- 11 RELIGION
- 12 HOW MANY PEOPLE OR MALES IN HOUSEHOLD/ FAMILY MEMBER DETAILS
- 97 Openend OTHER (SPECIFY)
- 98 Single IT DEPENDS
- 99 Single NONE
ENDIF
IF MENTIONED TYPE OF INFORMATION, OR DEPENDS ON TYPE OF INFORMATION (CODES 1 TO 98 ON Q3), ASK:
[Single]
Q5. And what is your MAIN reason for not wanting to provide this type of information?
IF OTHER, HIGHLIGHT OTHER AND TYPE IN RESPONSE
- 1 MAY LEAD TO FINANCIAL LOSS/ PEOPLE MIGHT ACCESS BANK ACCOUNT
- 2 IT’S NONE OF THEIR BUSINESS/ INVASION OF PRIVACY
- 3 DISCRIMINATION
- 4 I DO NOT WHAT TO BE IDENTIFIED
- 5 I DO NOT WANT PEOPLE KNOWING WHERE I LIVE/ OR HOW TO CONTACT ME
- 6 THE INFORMATION MAY BE MISUSED
- 7 INFORMATION MIGHT BE PASSED ON WITHOUT MY KNOWLEDGE
- 8 DON’T WANT JUNK MAIL/ UNSOLICITED MAIL/ SPAM
- 9 I DON’T WANT TO BE BOTHERED/ HASSLED/ HOUNDED (BY PHONE/ DOOR TO DOOR) 10 FOR SAFETY/ SECURITY/ PROTECTION (FROM CRIME)
- 11 UNNECESSARY/ IRRELEVANT TO THEIR BUSINESS OR CAUSE
- 97 Openend OTHER (SPECIFY)
- 98 Single CAN’T SAY
ASK EVERYONE
[Multiple]
Q6. Which of the following statements BEST DESCRIBE how you GENERALLY feel when organisations that you have NEVER DEALT WITH BEFORE send you unsolicited marketing information? Would you say...?
READ OUT.
IF OTHER, HIGHLIGHT OTHER AND TYPE IN RESPONSE
- 1 I Feel Angry And Annoyed
- 2 I Feel Concerned About Where They Obtained My Personal Information
- 3 It Doesn’t Bother Me Either Way, I Don’t Care
- 4 It’s A Bit Annoying But It’s Harmless
- 5 I Enjoy Reading The Material And Don’t Mind Getting It At All
- 97 Fixed Openend Or Something Else (SPECIFY)
- 98 Fixed Single (DON’T READ) CAN’T SAY
The next few questions concern the type of public information that should or should not be available to businesses for marketing purposes.
[Single]
Q37. Do you agree or disagree that businesses should be able to use the electoral roll for marketing purposes?
IF AGREE: Is that strongly agree or partly agree
IF DISAGREE: Is that strongly disagree or partly disagree
- 1 STRONGLY AGREE
- 2 PARTLY AGREE
- 3 NEITHER AGREE NOR DISAGREE
- 4 PARTLY DISAGREE
- 5 STRONGLY DISAGREE
- 6 CAN’T SAY
[Single]
Q38. Do you agree or disagree that businesses should be able to collect your information from the White Pages telephone directory without your knowledge for the purposes of marketing?
IF AGREE: Is that strongly agree or partly agree
IF DISAGREE: Is that strongly disagree or partly disagree
- 1 STRONGLY AGREE
- 2 PARTLY AGREE
- 3 NEITHER AGREE NOR DISAGREE
- 4 PARTLY DISAGREE
- 5 STRONGLY DISAGREE
- 6 CAN’T SAY
[Single]
Q36D. Over the last two years, would you say the number of times you have been asked to show identification such as a drivers license or passport to establish your identity has increased, decreased or stayed about the same?
- 1 INCREASE
- 2 DECREASE
- 3 ABOUT THE SAME
- 4 CAN’T SAY
[Single]
Q36E. Do you consider such demands for identification to be an invasion of privacy?
- 1 YES
- 2 NO
- 3 CAN’T SAY
The next questions are about how much you trust certain organisations with your personal information. How trustworthy or untrustworthy would you say the following organisations are with regards to how they protect or use your personal information?
Q9A - Q9J WILL BE ROTATED EXCLUDING Q9F.
[Single]
Q9A. FINANCIAL ORGANISATIONS SUCH AS BANKS, BUILDING SOCIETIES AND CREDIT UNIONS? (Would you say these types of organisations are trustworthy or untrustworthy when it comes to the protection or use of your personal information?)
IF TRUSTWORTHY: Is that highly trustworthy or somewhat trustworthy?
IF UNTRUSTWORTHY: Is that highly untrustworthy or somewhat untrustworthy?
- 1 HIGHLY TRUSTWORTHY
- 2 SOMEWHAT TRUSTWORTHY
- 3 NEITHER TRUSTWORTHY NOR UNTRUSTWORTHY
- 4 SOMEWHAT UNTRUSTWORTHY
- 5 HIGHLY UNTRUSTWORTHY
- 6 CAN’T SAY
[Single]
Q9B. REAL ESTATE AGENTS? (Would you say these types of organisations are trustworthy or untrustworthy when it comes to the protection or use of your personal information?)
IF TRUSTWORTHY: Is that highly trustworthy or somewhat trustworthy?
IF UNTRUSTWORTHY: Is that highly untrustworthy or somewhat untrustworthy?
- 1 HIGHLY TRUSTWORTHY
- 2 SOMEWHAT TRUSTWORTHY
- 3 NEITHER TRUSTWORTHY NOR UNTRUSTWORTHY
- 4 SOMEWHAT UNTRUSTWORTHY
- 5 HIGHLY UNTRUSTWORTHY
- 6 CAN’T SAY
[Single]
Q9C. MAIL ORDER COMPANIES? (Would you say these types of organisations are trustworthy or untrustworthy when it comes to the protection or use of your personal information?)
IF TRUSTWORTHY: Is that highly trustworthy or somewhat trustworthy?
IF UNTRUSTWORTHY: Is that highly untrustworthy or somewhat untrustworthy?
- 1 HIGHLY TRUSTWORTHY
- 2 SOMEWHAT TRUSTWORTHY
- 3 NEITHER TRUSTWORTHY NOR UNTRUSTWORTHY
- 4 SOMEWHAT UNTRUSTWORTHY
- 5 HIGHLY UNTRUSTWORTHY
- 6 CAN’T SAY
[Single]
Q9D. CHARITIES? (Would you say these types of organisations are trustworthy or untrustworthy when it comes to the protection or use of your personal information?)
IF TRUSTWORTHY: Is that highly trustworthy or somewhat trustworthy?
IF UNTRUSTWORTHY: Is that highly untrustworthy or somewhat untrustworthy?
- 1 HIGHLY TRUSTWORTHY
- 2 SOMEWHAT TRUSTWORTHY
- 3 NEITHER TRUSTWORTHY NOR UNTRUSTWORTHY
- 4 SOMEWHAT UNTRUSTWORTHY
- 5 HIGHLY UNTRUSTWORTHY
- 6 CAN’T SAY
[Single]
Q9E. GOVERNMENT ORGANISATIONS? (Would you say these types of organisations are trustworthy or untrustworthy when it comes to the protection or use of your personal information?)
IF TRUSTWORTHY: Is that highly trustworthy or somewhat trustworthy?
IF UNTRUSTWORTHY: Is that highly untrustworthy or somewhat untrustworthy?
- 1 HIGHLY TRUSTWORTHY
- 2 SOMEWHAT TRUSTWORTHY
- 3 NEITHER TRUSTWORTHY NOR UNTRUSTWORTHY
- 4 SOMEWHAT UNTRUSTWORTHY
- 5 HIGHLY UNTRUSTWORTHY
- 6 CAN’T SAY
[Single]
Q9G. HEALTH SERVICE PROVIDERS, INCLUDING DOCTORS AND HOSPITALS? (Would you say these types of organisations are trustworthy or untrustworthy when it comes to the protection or use of your personal information?)
IF TRUSTWORTHY: Is that highly trustworthy or somewhat trustworthy?
IF UNTRUSTWORTHY: Is that highly untrustworthy or somewhat untrustworthy?
- 1 HIGHLY TRUSTWORTHY
- 2 SOMEWHAT TRUSTWORTHY
- 3 NEITHER TRUSTWORTHY NOR UNTRUSTWORTHY
- 4 SOMEWHAT UNTRUSTWORTHY
- 5 HIGHLY UNTRUSTWORTHY
- 6 CAN’T SAY
[Single]
Q9H. MARKET RESEARCH ORGANISATIONS? (Would you say these types of organisations are trustworthy or untrustworthy when it comes to the protection or use of your personal information?)
IF TRUSTWORTHY: Is that highly trustworthy or somewhat trustworthy?
IF UNTRUSTWORTHY: Is that highly untrustworthy or somewhat untrustworthy?
- 1 HIGHLY TRUSTWORTHY
- 2 SOMEWHAT TRUSTWORTHY
- 3 NEITHER TRUSTWORTHY NOR UNTRUSTWORTHY
- 4 SOMEWHAT UNTRUSTWORTHY
- 5 HIGHLY UNTRUSTWORTHY
- 6 CAN’T SAY
[Single]
Q9I. RETAILERS? (Would you say these types of organisations are trustworthy or untrustworthy when it comes to the protection or use of your personal information?)
IF TRUSTWORTHY: Is that highly trustworthy or somewhat trustworthy?
IF UNTRUSTWORTHY: Is that highly untrustworthy or somewhat untrustworthy?
- 1 HIGHLY TRUSTWORTHY
- 2 SOMEWHAT TRUSTWORTHY
- 3 NEITHER TRUSTWORTHY NOR UNTRUSTWORTHY
- 4 SOMEWHAT UNTRUSTWORTHY
- 5 HIGHLY UNTRUSTWORTHY
- 6 CAN’T SAY
[Single]
Q9J. COMPANIES SELLING OVER THE INTERNET? (Would you say these types of organisations are trustworthy or untrustworthy when it comes to the protection or use of your personal information?)
IF TRUSTWORTHY: Is that highly trustworthy or somewhat trustworthy?
IF UNTRUSTWORTHY: Is that highly untrustworthy or somewhat untrustworthy?
- 1 HIGHLY TRUSTWORTHY
- 2 SOMEWHAT TRUSTWORTHY
- 3 NEITHER TRUSTWORTHY NOR UNTRUSTWORTHY
- 4 SOMEWHAT UNTRUSTWORTHY
- 5 HIGHLY UNTRUSTWORTHY
- 6 CAN’T SAY
CODES 1-5 FOR Q11 WILL BE ROTATED.
[Multiple]
Q11. When dealing with businesses that require your personal information, which of the following aspects of customer service are most important to you? Please rank them starting with the MOST important and finishing with the LEAST important.
INTERVIEWER NOTE: READ OUT LIST SLOWLY AND REPEAT AS OFTEN AS NECESSARY.
RESPONSES MUST BE HIGHLIGHTED IN ORDER, FROM MOST IMPORTANT TO LEAST.
- 1 Convenience
- 2 Efficiency Of Service
- 3 Quality Of Product Or Service
- 4 Price
- 5 Respect For, And Protection Of, My Personal Information
- 98 Fixed Single (DON’T READ) CAN’T SAY
[Single]
Q12. GENERALLY, how likely or unlikely would you be to provide your personal information to an organisation if it meant you would receive discounted purchases?
IF LIKELY - Is that very likely or quite likely?
IF UNLIKELY - Is that very unlikely or quite unlikely?
- 1 VERY LIKELY
- 2 QUITE LIKELY
- 3 NEITHER LIKELY NOR UNLIKELY
- 4 QUITE UNLIKELY
- 5 VERY UNLIKELY
- 6 CAN’T SAY
- 7 DEPENDS ON ORGANISATION
[Single]
Q13. GENERALLY, how likely or unlikely would you be to provide your personal information to an organisation if it meant you would receive more efficient and personalised service?
IF LIKELY - Is that very likely or quite likely?
IF UNLIKELY - Is that very unlikely or quite unlikely?
- 1 VERY LIKELY
- 2 QUITE LIKELY
- 3 NEITHER LIKELY NOR UNLIKELY
- 4 QUITE UNLIKELY
- 5 VERY UNLIKELY
- 6 CAN’T SAY
- 7 DEPENDS ON ORGANISATION
LEVEL OF KNOWLEDGE
The next few questions are about possible current practices regarding the use and security of personal information such as your name, age, address, & interests. Please state whether you think the following statements are true or false. If you don’t know, or haven’t really thought about it, just say “Can’t Say.”
Q17 - Q20 WILL BE ROTATED.
[Single]
Q17. “Customer details held by commercial organisations are often transferred or sold in mailing lists to other businesses.”
Would you say this statement was true or false?
- 1 TRUE
- 2 FALSE
- 3 CAN’T SAY
[Single]
Q18. “Charities, private schools, private hospitals and other non-government organisations are free to sell or transfer customer lists containing personal details to other organisations.”
Would you say this statement was true or false?
- 1 TRUE
- 2 FALSE
- 3 CAN’T SAY
[Single]
Q19. “The way government departments or government agencies collect, protect and use people’s personal information is up to the individual departments as they are not bound by any Federal privacy laws or legislation.”
Would you say this statement was true or false?
- 1 TRUE
- 2 FALSE
- 3 CAN’T SAY
[Single]
Q20. “Banks, insurance companies and other financial organisations are NOT currently bound by privacy laws which restrict the way they can use their customers’ personal details.”
Would you say this statement was true or false?
- 1 TRUE
- 2 FALSE
- 3 CAN’T SAY
That was the last true or false statement. Please be aware that all the above scenarios were FALSE. Currently privacy laws do exist. The laws outline procedures for the collection, use and storage of people’s personal information and apply to Federal government departments and agencies, as well as to health services and many businesses.
[Single]
Q21. Were you aware of the PRIVACY LAWS before this interview?
- 1 YES
- 2 NO
- 3 CAN’T SAY
CODES 1-5 FOR Q22 WILL BE ROTATED.
[Single]
Q22. How much would you say you know about your rights when it comes to protecting your personal information? Would you say you know #/a lot, an adequate amount, some, very little or nothing/ nothing, very little, some, an adequate amount or a lot/?
- 1 A LOT
- 2 AN ADEQUATE AMOUNT
- 3 SOME
- 4 VERY LITTLE
- 5 NOTHING
- 6 Fixed Single CAN’T SAY
[Multiple]
Q23. If you wanted to report the mis-use of your personal information, who would you be most likely to contact? DO NOT READ OUT Anyone else?
IF OTHER, HIGHLIGHT OTHER AND TYPE IN RESPONSE
- 1 POLICE
- 2 OMBUDSMAN
- 3 THE ORGANISATION WHO WAS INVOLVED
- 4 THE PRIVACY COMMISSIONER (FEDERAL OR STATE)
- 5 CONSUMER AFFAIRS (IN YOUR STATE)
- 6 LOCAL STATE MP
- 7 STATE GOVERNMENT DEPARTMENT
- 8 LOCAL COUNCIL
- 9 LAWYERS/ SOLICITORS
- 10 DEPARTMENT OF FAIR TRADING
- 11 SEEK ADVICE FROM A FRIEND OR RELATIVE
- 12 THE MEDIA EG TV/ RADIO/ NEWSPAPERS
- 97 Openend OTHER (SPECIFY)
- 98 Single CAN’T SAY
[Single]
Q24. Are you aware that a Federal Privacy Commissioner exists to uphold privacy laws and to investigate complaints people may have concerning the misuse of their personal information?
- 1 YES
- 2 NO
- 3 CAN’T SAY
CODES 1-5 ON Q10A WILL BE ROTATED.
[Single] {Rotate}
Q10A. Many organisations have a publicly available privacy policy. If there was a requirement that all privacy policies have a one page summary,in terms of the personal information the company has, which ONE of the following do you think is MOST IMPORTANT to be in this summary?
READ OUT
NOTE: (PERSONAL) WILL ONLY BE READ OUT FOR THE FIRST CODE IN WHICH IT APPEARS
- 1 What (personal) Information Will Be Kept
- 2 How The (personal) Information Will Be Used
- 3 If And When The Organisation Will Pass On My (personal) Information
- 4 How To Prevent Being Contacted For Marketing Purposes
- 5 How To Access Or Change My (personal) Information
- 6 Fixed Single (DON’T READ) CAN’T SAY
- 7 Fixed Single (DON’T READ) DON’T KNOW WHAT A PRIVACY POLICY IS
IF ANY CODES 1-5 MENTIONED IN Q10A, ASK
[Single]
Q10B. And which would be SECOND most important?
IF NECESSARY READ OUT CODES NOT MENTIONED IN Q10A
NOTE: (PERSONAL) WILL ONLY BE READ OUT FOR THE FIRST CODE IN WHICH IT APPEARS
- 1 What (personal) Information Will Be Kept
- 2 How The (personal) Information Will Be Used
- 3 If And When The Organisation Will Pass On My (personal) Information
- 4 How To Prevent Being Contacted For Marketing Purposes
- 5 How To Access Or Change My (personal) Information
- 6 Fixed Single (DON’T READ) CAN’T SAY
- 7 Fixed Single (DON’T READ) DON’T KNOW WHAT A PRIVACY POLICY IS
ENDIF
IF ANY CODES 1-5 MENTIONED IN Q10B, ASK
[Single]
Q10C. And which is the THIRD most important?
IF NECESSARY READ OUT CODES NOT MENTIONED IN Q10A OR Q10B
NOTE: (PERSONAL) WILL ONLY BE READ OUT FOR THE FIRST CODE IN WHICH IT APPEARS
- 1 What (personal) Information Will Be Kept
- 2 How The (personal) Information Will Be Used
- 3 If And When The Organisation Will Pass On My (personal) Information
- 4 How To Prevent Being Contacted For Marketing Purposes
- 5 How To Access Or Change My (personal) Information
- 6 Fixed Single (DON’T READ) CAN’T SAY
- 7 Fixed Single (DON’T READ) DON’T KNOW WHAT A PRIVACY POLICY IS
ASK EVERYONE
HEALTH INFORMATION NETWORK
The next few questions concern medical or health information and privacy.
[Single]
Q32. (Do you agree or disagree with the following statements?)
Your doctor should be able to discuss your personal medical details with other health professionals - in a way that identified you - WITHOUT YOUR CONSENT if they thought this would assist your treatment?
IF AGREE: Is that strongly agree or partly agree
IF DISAGREE: Is that strongly disagree or partly disagree
- 1 STRONGLY AGREE
- 2 PARTLY AGREE
- 3 NEITHER AGREE NOR DISAGREE
- 4 PARTLY DISAGREE
- 5 STRONGLY DISAGREE
- 6 Fixed Single CAN’T SAY
[Single]
Q27. (Do you agree or disagree with this suggestion?)
To enable the government to better track the use of HEALTH SERVICES, all individuals should be allocated a NUMBER and that number should be used when accessing ANY health service or facility.
IF AGREE: Is that strongly agree or partly agree
IF DISAGREE: Is that strongly disagree or partly disagree
- 1 STRONGLY AGREE
- 2 PARTLY AGREE
- 3 NEITHER AGREE NOR DISAGREE
- 4 PARTLY DISAGREE
- 5 STRONGLY DISAGREE
- 6 Fixed Single CAN’T SAY
If a National health information network existed it would involve entering all medical records onto an Australia wide database. This would allow a patient’s medical information to be easily and quickly transferred to a treating doctor anywhere in Australia. Such a network could also be used to gather information on National health statistics.
[Single]
Q30. If such a database existed, do you think inclusion of your medical information should be VOLUNTARY, or should ALL MEDICAL RECORDS be entered as a matter of course?
IF OTHER, HIGHLIGHT OTHER AND TYPE IN RESPONSE
- 1 INCLUSION SHOULD BE VOLUNTARY
- 2 ALL MEDICAL RECORDS SHOULD BE ENTERED
- 97 Openend OTHER (SPECIFY)
- 98 Single CAN’T SAY
[Single]
Q31. Health information is often sought for research purposes and is generally de-identified - that is, NOT linked with information that identifies an individual. Do you believe that an individual’s permission should be sought before their de-identified health information is released for research purposes, or not?
- 1 YES
- 2 NO
- 3 MAYBE
- 4 CAN’T SAY
GOVERNMENT QUESTIONS
The next questions cover Government Departments and privacy
[Single]
36A. It has been suggested that each Australian should be given a unique number, like a tax file number, to be used for identification in ALL Commonwealth Government Departments, and to access government services on the Internet. In principle, are you in favour or against each Australian being given such a number?
IF IN FAVOUR: Is that strongly in favour, or partly in favour?
IF AGAINST: Is that strongly against, or partly against?
- 1 STRONGLY IN FAVOUR
- 2 PARTLY IN FAVOUR
- 3 PARTLY AGAINST
- 4 STRONGLY AGAINST
- 5 (DO NOT READ OUT) NEITHER IN FAVOUR NOR AGAINST
- 6 (DO NOT READ OUT) CAN’T SAY
[Single]
36B. Do you believe government departments should be able to cross-reference or share information in their databases for:
- 1 Any Purpose
- 2 Some Purposes
- 3 Not At All
- 4 Can’t Say
IF SOME PURPOSES (CODE 2 IN Q36B), ASK, OTHERWISE GO TO Q33:
Q36C1 - Q36C3 WILL BE ROTATED.
For which of the following purposes do you believe governments should be allowed to cross reference information?
[Single]
Q36C1. For updating basic information like address details
(For which of the following purposes do you believe governments should be allowed to cross reference information?)
- 1 Yes
- 2 No
- 3 Can’t Say
[Single]
Q36C2. To solve or prevent fraud or other crime
(For which of the following purposes do you believe governments should be allowed to cross reference information?)
- 1 Yes
- 2 No
- 3 Can’t Say
[Single]
Q36C3. To reduce costs, or improve efficiency
(For which of the following purposes do you believe governments should be allowed to cross reference information?)
- 1 Yes
- 2 No
- 3 Can’t Say
ASK EVERYONE
I would like you now to think about your privacy and businesses.
Which of the following instances would you regard to be an invasion of the privacy of your personal information?
Q33 - Q36 WILL BE ROTATED.
[Single]
Q33. A business that you don’t know gets hold of your personal information.
(Would you say this was an invasion of the privacy of your personal information?)
- 1 YES/ INVASION OF PRIVACY
- 2 NO
- 3 CAN’T SAY
[Single]
Q34. A business monitors your activities on the internet, recording information on the sites you visit without your knowledge.
(Would you say this was an invasion of the privacy of your personal information?)
- 1 YES/ INVASION OF PRIVACY
- 2 NO
- 3 CAN’T SAY
[Single]
Q35. You supply your information to a business for a specific purpose and the business uses it for another purpose.
(Would you say this was an invasion of the privacy of your personal information?)
- 1 YES/ INVASION OF PRIVACY
- 2 NO
- 3 CAN’T SAY
[Single]
Q36. A business asks you for personal information that doesn’t seem relevant to the purpose of the transaction.
(Would you say this was an invasion of the privacy of your personal information?)
- 1 YES/ INVASION OF PRIVACY
- 2 NO
- 3 CAN’T SAY
INTERNET
[Single]
Q39. The next few questions concern the internet. Do you use the internet at home or work AT LEAST ONCE A WEEK?
- 1 YES
- 2 NO
- 4 CAN’T SAY
IF USE THE INTERNET (CODE 1 ON Q39), ASK Q40 - Q44, OTHERWISE GO TO Q45:
[Single]
Q40. GENERALLY, when dealing over the internet, would you say you have #/MORE CONCERNS about the security of your personal details than usual, FEWER concerns or about the same/FEWER CONCERNS about the security of your personal details than usual, MORE concerns or about the same/?
- 1 MORE CONCERNS
- 2 FEWER CONCERNS
- 3 Fixed Single ABOUT THE SAME
- 4 Fixed Single CAN’T SAY
[Single]
Q41. Do you have your web browser set to reject cookies? If you don’t know what this means, just say so as this is of interest as well.
- 1 YES
- 2 NO
- 3 CAN’T SAY
- 4 DON’T KNOW WHAT YOU ARE TALKING ABOUT
[Single]
Q42. When completing online forms or applications that ask for personal details, have you ever PROVIDED FALSE INFORMATION as a means of protecting your privacy?
- 1 YES
- 2 NO
- 3 CAN’T SAY
[Single]
42B. Are you MORE OR LESS concerned about your privacy while using the internet than you were two years ago?
- 1 MORE CONCERNED
- 2 LESS CONCERNED
- 3 ABOUT THE SAME
- 4 CAN’T SAY
[Single]
Q43. Have you ever seen or read the privacy policy attached to any internet site?
- 1 YES
- 2 NO
- 3 CAN’T SAY
IF SEEN OR READ PRIVACY POLICY (CODE 1 ON Q43), ASK, OTHERWISE GO TO Q45:
[Multiple]
Q44. What impact, if any, did seeing or reading these privacy policies have upon your attitude towards the site?
DO NOT READ OUT
IF OTHER, HIGHLIGHT OTHER AND TYPE IN RESPONSE
- 1 IT’S A GOOD IDEA/ I APPROVE OF THE PRIVACY POLICY/ THEY ARE DOING THE RIGHT THING/ PREFER TO SEE IT ON SITES/ RESPECT SITES FOR HAVING IT
- 2 FEEL MORE CONFIDENT/ COMFORTABLE/ SECURE ABOUT USING THE SITE
- 3 APPEAR MORE HONEST/ TRUSTWORTHY/ RESPONSIBLE/ LEGITIMATE
- 4 HELPS ME DECIDE WHETHER TO USE THE SITE OR NOT
- 5 STILL APPREHENSIVE ABOUT SITES THAT HAVE THEM/ DON’T TRUST THEM/ NOT CONVINCED
- 6 MADE ME MORE CAUTIOUS/ AWARE WHEN USING THE INTERNET GENERALLY
- 7 TOO LONG/ TO COMPLICATED TO READ
- 97 Openend OTHER (SPECIFY)
- 98 Single CAN’T SAY
- 99 Single NONE/ NO IMPACT
ASK EVERYONE
[Single]
Q45. Do you have Internet access on a HOME computer?
- 1 YES
- 2 NO
- 3 CAN’T SAY
IF HAVE INTERNET ACCESS AT HOME (CODE 1 ON Q45) ASK, OTHERWISE GO TO Q46B:
Q45A1 - Q45A6 WILL BE ROTATED
Which of the following do you currently have on your home computer? If you are not sure about any of these, please let me know. Do you
[Single]
Q45A1. Use a firewall
(Which of the following do you currently do on you home computer? If you are not sure about any of these, please let me know)
- 1 YES/ SOMETIMES
- 2 NO
- 3 DON’T KNOW WHAT IT IS / CAN’T SAY
[Single]
Q45A2. Regularly update antivirus software
(Which of the following do you currently do on you home computer? If you are not sure about any of these, please let me know)
- 1 YES/ SOMETIMES
- 2 NO
- 3 DON’T KNOW WHAT IT IS / CAN’T SAY
[Single]
Q45A3. Use free email accounts temporarily
(Which of the following do you currently do on you home computer? If you are not sure about any of these, please let me know)
- 1 YES/ SOMETIMES
- 2 NO
- 3 DON’T KNOW WHAT IT IS / CAN’T SAY
[Single]
Q45A4. Ever reject cookies
(Which of the following do you currently do on you home computer? If you are not sure about any of these, please let me know)
- 1 YES/ SOMETIMES
- 2 NO
- 3 DON’T KNOW WHAT IT IS / CAN’T SAY
[Single]
Q45A5. Use a spam filter
(Which of the following do you currently do on you home computer? If you are not sure about any of these, please let me know)
- 1 YES/ SOMETIMES
- 2 NO
- 3 DON’T KNOW WHAT IT IS / CAN’T SAY
[Single]
Q45A6. Use software to protect your anonymity online
(Which of the following do you currently do on you home computer? If you are not sure about any of these, please let me know)
- 1 YES/ SOMETIMES
- 2 NO
- 3 DON’T KNOW WHAT IT IS / CAN’T SAY
ASK EVERYONE
EMPLOYEE PRIVACY
Now for a few questions about employees privacy in the workplace
[Single]
Q46B. Do you think that employees should have access to the information their employer holds about them?
- 1 YES
- 2 NO
- 3 CAN’T SAY
Q47,Q48 & Q52 WILL BE ROTATED
For each of the following, could you tell me if you think it’s appropriate behaviour for an employer to do whenever they choose, only if they suspect wrong-doing or not at all.
[Single]
Q47. Read e-mails sent to a work email account
(Do you feel this is appropriate behaviour for an employer to do whenever they choose, only if they suspect wrong-doing or not at all)
- 1 WHENEVER THEY CHOOSE
- 2 ONLY IF THEY SUSPECT WRONG-DOING
- 3 NOT AT ALL
- 4 CAN’T SAY
[Single]
Q48. Use surveillance equipment such as video and audio cameras to monitor the workplace
(Do you feel this is appropriate behaviour for an employer to do whenever they choose, only if they suspect wrong-doing or not at all)
- 1 WHENEVER THEY CHOOSE
- 2 ONLY IF THEY SUSPECT WRONG-DOING
- 3 NOT AT ALL
- 4 CAN’T SAY
[Single]
Q52. Monitor everything an employee types into their computer, including what web sites they visit and what they type into emails
(Do you feel this is appropriate behaviour for an employer to do whenever they choose, only if they suspect wrong-doing or not at all)
- 1 WHENEVER THEY CHOOSE
- 2 ONLY IF THEY SUSPECT WRONG-DOING
- 3 NOT AT ALL
- 4 CAN’T SAY
[Single]
Q49. Listen to telephone conversations...Do you feel this is appropriate behaviour for an employer to do whenever they choose, FOR TRAINING AND QUALITY CONTROL, only if they suspect wrong-doing or not at all?
SINGLE RESPONSE: INTERVIEWER NOTE, IF 2+ MENTIONED, ASK WHICH ONE BEST DESCRIBES THEIR VIEW
- 1 WHENEVER THEY CHOOSE
- 2 ONLY IF THEY SUSPECT WRONG-DOING
- 3 FOR TRAINING AND QUALITY CONTROL
- 4 NOT AT ALL
- 5 CAN’T SAY
[Single]
Q50. Randomly drug test employees...Do you feel this is appropriate behaviour for an employer to do whenever they choose, ONLY IF NECESSARY TO ENSURE SAFETY, or not at all
- 1 WHENEVER THEY CHOOSE
- 2 ONLY IF NECESSARY TO ENSURE SAFETY
- 3 NOT AT ALL
- 4 CAN’T SAY
CODES 1-4 FOR Q53 WILL BE ROTATED
[Single]
Q53. How important is it to you that an employer has a privacy policy that covers when they will read employee emails, randomly drug test employees, use surveillance equipment to monitor employees and listen to telephone conversations. Is it #/not at all important, not very important, quite important or very important/very important, quite important, not very important or not at all important/?
- 1 NOT AT ALL IMPORTANT
- 2 NOT VERY IMPORTANT
- 3 QUITE IMPORTANT
- 4 VERY IMPORTANT
- 5 Fixed CAN’T SAY
DEMOGRAPHICS
Finally, a few questions about yourself, just to ensure we have spoken to a representative cross section of people.
[Single]
Q55. What is the highest level of education you have reached?
IF OTHER, HIGHLIGHT OTHER AND TYPE IN RESPONSE.
- 1 PRIMARY SCHOOL
- 2 SOME SECONDARY SCHOOL
- 3 SOME TECHNICAL OR COMMERCIAL
- 4 PASSED 4TH FORM/ YEAR 10
- 5 PASSED 5TH FORM/ YEAR 11/ LEAVING
- 6 FINISHED TECHNICAL SCHOOL, COMMERCIAL COLLEGE OR TAFE
- 7 FINISHED/ NOW STUDYING H.S.C./ V.C.E./ YEAR 12
- 8 DIPLOMA FROM C.A.E.
- 9 SOME UNIVERSITY/ C.A.E.
- 10 DEGREE FROM UNIVERSITY OR CAE
- 11 Openend OTHER (SPECIFY)
- 12 CAN’T SAY
[Single]
Q56A. Are you now in paid employment?
IF YES, ASK: Is that FULL-time for 35 hours or more a week, or part-time?
IF NO, ASK: Are you retired or a student?
- 1 YES, FULL-TIME
- 2 YES, PART-TIME
- 3 NO, RETIRED
- 4 NO, STUDENT
- 5 OTHER NONWORKER
- 6 REFUSED
[Quantity] {Min: 1, Max: 14}
Q56B. What is your (last) occupation - the position and industry?
- 1: Professional
- 2: Owner or Executive
- 3: Owner of Small Businesses
- 4: Other White Collar
- 5: Skilled
- 6: Semi-Skilled
- 7: Unskilled
- 8: Farm Owner
- 9: Farm Worker
- 10: No Occupation
- 11: Sales
- 12: Semi-Professional
- 13: No occupation
- 14: REFUSED
[Single]
Q54. Would you mind telling me your household’s TOTAL approximate annual income from all sources, before tax? DO NOT READ OUT!
IF CAN’T SAY, ASK: Well, your best guess?
- 1 LESS THAN $10,000
- 2 $10,000 - $14,999
- 3 $15,000 - $19,999
- 4 $20,000 - $24,999
- 5 $25,000 - $29,999
- 6 $30,000 - $34,999
- 7 $35,000 - $39,999
- 8 $40,000 - $44,999
- 9 $45,000 - $49,999
- 10 $50,000 - $59,999
- 11 $60,000 - $79,999
- 12 $80,000 - $99,999
- 13 $100,000 - $109,999
- 14 $110,000 - $119,999
- 15 $120,000 - $129,999
- 16 $130,000 - $139,999
- 17 $140,000 - $149,999
- 18 $150,000 OR MORE
- 19 CAN’T SAY
- 20 REFUSED
That brings us to the end of the survey. Thankyou for your time and help. Just to remind you, my name is (SAY NAME) and I am calling from Roy Morgan Research. This survey was conducted on behalf of the Office of the Federal Privacy Commissioner.
This survey was conducted in compliance with the Privacy Principles, and I would like to assure you that the information you have provided will not be linked to any of your personal information. If you would like any further information about this survey, I can give you a contact number, would you like this number? IF NO - THANK AND CLOSE IF YES - please contact XXXX XXXX from Roy Morgan Research, the Project Manager for this research on XX XXXX XXXX, or XXXX XXXX from the Office of the Privacy Commissioner. His number is XX XXXX XXXX, during business hours.
Thank you for your time and assistance.
Appendix two — verification study
There were some concerns that some of the questions in the 2004 Privacy Study may be influenced by the context created by the preceding questions. Three questions likely to face such a bias were re-asked in the Verification Study, using CATIBUS. The CATIBUS is a multi-client telephone Omnibus conducted by Roy Morgan Research amongst 600 Australians aged 14+ weekly. The Questions were run over two weeks, amongst respondents aged 18 years or older. The placement of these questions on the CATIBUS ensured:
- The three privacy questions were separated from each other by other sections;
- The privacy questions were asked after sections which would not create any undue contextual bias; and
- The order of the privacy questions were rotated across each week of the CATIBUS.
The questions on the CATIBUS were unchanged from the stand alone study, however if necessary an introductory sentence was included in some instances. Sample design and weighting were performed in a manner consistent with the stand alone study. Auditing and response rates were all conducted in-line with Roy Morgan Research quality control procedures and deemed satisfactory.
For the CATIBUS, the sampling variation for the sample at the national level is 1.3% to 2.9%.
Responses for two questions verified showed an extremely high degree of similarity between the Privacy Survey 2004 and the Verification Survey.
Table 48: Attitudes Towards Inclusion of Medical Records in National Health Database
If such a database existed, do you think inclusion of your medical information should be VOLUNTARY, or should ALL MEDICAL RECORDS be entered as a matter of course?
| Response | Privacy Survey 2004 | Verification Study (CATIBUS) |
|---|---|---|
| Inclusion Should Be Voluntary | 64% | 64% |
|
All Medical Records Should be Entered as a Matter of Course | 32% | 32% |
| Other | 2% | 2% |
| Can’t Say | 2% | 2% |
Table 49: Attitudes Towards a Unique Identifier for All Australian Government Departments
It has been suggested that each Australian should be given a unique number, like a tax file number, to be used for identification in ALL Commonwealth Government Departments, and to access government services on the Internet. In principle, are you in favour or against each Australian being given such a number?
| Response | Privacy Survey 2004 | Verification Study (CATIBUS) |
|---|---|---|
| Strongly in Favour | 25% | 26% |
| Partly in Favour | 28% | 27% |
| Neither in Favour nor against | 4% | 4% |
| Partly Against | 13% | 14% |
| Strongly Against | 28% | 27% |
| Can’t Say | 2% | 2% |
However, the third question did show some differences.
Table 50: Reactions to Businesses Using the White Pages for Marketing
Do you agree or disagree that businesses should be able to collect your information from the White Pages telephone directory without your knowledge for the purposes of marketing?
| Response | Privacy Survey 2004 | Verification Study (CATIBUS) |
|---|---|---|
| Strongly Agree | 12% | 6% |
| Partly Agree | 32% | 23% |
| Neither Agree nor Disagree | 8% | 4% |
| Partly Disagree | 14% | 18% |
| Strongly Disagree | 32% | 47% |
| Can’t Say | 2% | 1% |
In the Verification Study, the question was asked in isolation to other questions about privacy, following completely unrelated questions commissioned by another client of Roy Morgan Research. In the Privacy 2004 Study, there were a number of related questions asked immediately prior to the question on the White Pages. These were questions on:
- What type of personal information do you feel most reluctant to provide?
- Why?
- How do you feel when you receive marketing material?
- Should businesses be able to access the electoral roll for marketing?
- Should businesses be able to use the White Pages for Marketing?
In this instance, it is possible that contextual bias in the Privacy 2004 study may be the reason for this difference. Contextual bias occurs when the results to one question are influenced by the context in which the question was asked. Respondents to the Privacy 2004 study may have considered using the White Pages for marketing as a ’lesser evil’ than using the electoral roll, which may account for the more positive response to the use of White pages information for marketing than in the CATIBUS surveys.
Long text descriptions
Figure 7: Knowledge of rights to protect personal information
Figure 7 illustrates the responses to the question How much would you say you know about your rights when it comes to protecting your personal information? It compares responses from 2001 and 2004.
| Response | 2001 (n=1,524) % | 2004 (n=1,507) % |
|---|---|---|
| A lot | 3 | 4 |
| An adequate amount | 15 | 22 |
| Some level of knowledge | 29 | 35 |
| Very little | 46 | 34 |
| Nothing | 6 | 4 |
Figure 8: Awareness of federal privacy laws
Figure 8 illustrates the responses to the question Currently privacy laws do exist. The laws outline procedures for the collection, use and storage of people’s personal information and apply to Federal government departments and agencies, as well as to health services and many businesses. Were you aware of the PRIVACY LAWS before this interview? The responses are broken down by age and location.
Responses by age:
- 18-24 (n=184): 48%
- 25-34 (n=289): 57%
- 35-49 (n=445): 64%
- 50+ (n=445): 63%
Responses by location:
- Metropolitan (n=952): 63%
- Country (n=555): 55%
Figure 9: Reporting misuse of personal information
Figure 9 illustrates the responses to the question If you wanted to report the misuse of your personal information, who would you be most likely to contact? All 1,507 respondents answered, as follows:
- Ombudsman: 19%
- The organisation who was involved: 15%
- Police: 13%
- Consumer affairs (in your state): 10%
- Local state MP: 8%
- The Privacy Commissioner (Federal or State): 7%
- State government department: 6%
- Lawyers/Solicitors: 6%
- Department of Fair Trading: 4%
- Seek advice from a friend or relative: 4%
- Local council: 2%
- The media eg TV/Radio/Newspapers: 1%
- Other: 4%
- Can’t say: 29%
Figure 10: Belief that customer details often transferred or sold
Figure 10 illustrates the responses to the question Customer details held by commercial organisations are often transferred or sold in mailing lists to other businesses. Would you say this statement was true or false? Out of a total 1,507 respondents, 81% said true, 9% said false and 10% said can’t say. The responses are broken down by age group, as follows:
| Response | Total (n=1507) % | 18-24 (n=184) % | 25-34 (n=289) % | 35-49 (n=445) % | 50+ (n=445) % |
|---|---|---|---|---|---|
| True | 81 | 67 | 80 | 85 | 82 |
| False | 9 | 16 | 10 | 7 | 9 |
| Can’t say | 10 | 17 | 10 | 8 | 9 |
Figure 11: Respondents’ level of knowledge
Figure 11 illustrates the responses to the question Would you say this statement was true or false? followed by three statements. There were 1,507 respondents.
| Statement | True % | False % | Can’t say % |
|---|---|---|---|
| Government departments not bound by laws | 26 | 53 | 21 |
| Financial institutions not bound by laws | 29 | 56 | 14 |
| Charities and NGPs free to sell customer lists | 32 | 47 | 21 |
Figure 12: Respondents’ trust in organisations
Figure 12 illustrates the responses to the question Would you say these types of organisations are trustworthy or untrustworthy when it comes to the protection or use of your personal information? There were 1,507 respondents.
| Organisation | Trustworthy % | Neither trustworthy nor untrustworthy % | Untrustworthy % | Can’t say % |
|---|---|---|---|---|
| Health service providers | 89 | 3 | 5 | 3 |
| Financial orgs | 66 | 4 | 29 | 3 |
| Govt. orgs | 64 | 5 | 27 | 5 |
| Charities | 54 | 6 | 34 | 6 |
| Retailers | 39 | 7 | 47 | 6 |
| Market research orgs | 35 | 6 | 52 | 8 |
| Real estate | 26 | 4 | 61 | 8 |
| Mail order companies | 19 | 5 | 67 | 11 |
| Internet sales companies | 9 | 3 | 69 | 19 |
Figure 14: Respondents’ mean trust in organisations
Figure 14 illustrates the responses to the question Would you say these types of organisations are trustworthy or untrustworthy when it comes to the protection or use of your personal information? It compares the mean trustworthiness rating of each organisation from 2004 and 2001.
| Organisation | 2004 | 2001 |
|---|---|---|
| Health service providers | 4.43 | 4.16 |
| Financial orgs | 3.54 | 3.41 |
| Govt. orgs | 3.52 | 3.4 |
| Charities | 3.25 | 3.35 |
| Retailers | 2.78 | 2.81 |
| Market research orgs | 2.57 | 2.77 |
| Real estate | 2.3 | 2.4 |
| Internet sales companies | 1.72 | 1.98 |
Figure 15: Respondents’ perceptions of invasion of privacy
Figure 15 illustrates the responses to the question Would you say this was an invasion of the privacy of your personal information? followed by 5 different scenarios. It compares the proportion of respondents who considered the scenario an invasion of privacy from 2004 and 2001.
| Scenario | 2004 (n=1,507) % | 2001 (n=1,524) % |
|---|---|---|
| Business gets hold of personal info | 94 | 95 |
| Business monitors internet activity without permission | 93 | 90 |
| Business uses personal info for alternate purpose | 93 | 90 |
| Business asks for irrelevant personal info | 94 | 93 |
| Showing ID to establish identity | 16 | N/A |
Figure 19: Frequency leave information off forms
Figure 19 illustrates the responses to the question When completing forms or applications that ask for personal details, such as your name, contact details, income, marital status etc, how often, if ever, would you say YOU LEAVE SOME QUESTIONS BLANK as a means of protecting your personal information? It compares the results from 2004 and 2001.
| Response | 2004 (n=1,507) % | 2001 (n=1,524) % |
|---|---|---|
| Always | 9 | 7 |
| Often | 15 | 15 |
| Sometimes | 32 | 25 |
| Rarely | 18 | 23 |
| Never | 25 | 29 |
| Can’t say | 1 | 1 |
Figure 21: Mean frequency leave information off forms
Figure 21 illustrates the mean frequencies of responses to the question When completing forms or applications that ask for personal details, such as your name, contact details, income, marital status etc, how often, if ever, would you say YOU LEAVE SOME QUESTIONS BLANK as a means of protecting your personal information? The mean frequency of the total 1507 respondents was 2.65. The results are broken down by gender, age and household income.
Results by gender:
- Male (n=733): 2.58
- Female (n=774): 2.71
Results by age:
- 18-24 (n=184): 2.51
- 25-34 (n=289): 2.74
- 35-49 (n=445): 2.7
- 50+ (n=589): 2.61
Results by household income:
- <$50,000 (n=334): 2.34
- $50,000-$99,999 (n=341): 2.55
- $100,000+ (n=199): 2.61
Figure 22: Decided not to deal with an organisation to protect personal information
Figure 22 illustrates the responses to the question Firstly, have you ever decided NOT TO DEAL with a .... because of concerns over the protection or use of your personal information?
- PRIVATE COMPANY or CHARITY
- GOVERNMENT ORGANISATION or AGENCY
The mean frequency of the total 1507 respondents was 2.65. The results are broken down by gender, age and household income.
| Type of organisation | 2001 (n=1,524) % | 2004 (n=1,507) % |
|---|---|---|
| Decided Not To Deal with a private Company or Charity | 42 | 33 |
| Decided Not To Deal with a Government Department or Agency | 14 | 16 |
Figure 23: Decided not to deal with an organisation by age
Figure 23 illustrates the responses broken down by age to the question Firstly, have you ever decided NOT TO DEAL with a .... because of concerns over the protection or use of your personal information?
- PRIVATE COMPANY or CHARITY
- GOVERNMENT ORGANISATION or AGENCY
| Type of organisation | 18-24 (n=184) % | 25-34 (n=289) % | 35-49 (n=445) % | 50+ (n=589) % |
|---|---|---|---|---|
| Decided Not To Deal with a private Company or Charity | 25 | 37 | 37 | 31 |
| Decided Not To Deal with a Government Department or Agency | 8 | 13 | 21 | 18 |
Figure 24: Reactions to unsolicited marketing material
Figure 24 illustrates the responses to the question Which of the following statements BEST DESCRIBE how you GENERALLY feel when organisations that you have NEVER DEALT WITH BEFORE send you unsolicited marketing information? It compares responses from 2004 and 2001.
| Response | 2001 (n=1,524) % | 2004 (n=1,507) % |
|---|---|---|
| I Feel Concerned About Where They Obtained My Personal Information | 55 | 48 |
| I Feel Angry And Annoyed | 25 | 21 |
| It’s A Bit Annoying But It’s Harmless | 20 | 23 |
| It Doesn’t Bother Me Either Way, I Don’t Care | 17 | 15 |
| I Enjoy Reading The Material And Don’t Mind Getting It At All | 9 | 7 |
Figure 25: Reactions to businesses using the electoral roll or White Pages for marketing
Figure 25 illustrates the responses to the question Do you agree or disagree that businesses should be able to use the ... for marketing purposes?
- electoral roll
- White Pages
It compares responses from 2001 and 2004.
| Response | 2004 (n=1,507) % | 2001 (n=1,524) % |
|---|---|---|
| Total agree | 44 | 42 |
| Neither agree nor disagree | 8 | 11 |
| Total disagree | 46 | 46 |
| Can’t say | 2 | 1 |
| Response | 2004 (n=1,507) % | 2001 (n=1,524) % |
|---|---|---|
| Total agree | 19 | 22 |
| Neither agree nor disagree | 2 | 6 |
| Total disagree | 77 | 70 |
| Can’t say | 2 | 2 |
Figure 27: Importance of respect and protection of personal information
Figure 27 illustrates the responses to the question When dealing with businesses that require your personal information, which of the following aspects of customer service are most important to you? Proportion rated importance of respect and protection of personal information as most important. 32% of the total 1507 respondents rated respect for, and protection of personal information as important. Responses are broken down by gender and household income.
Responses by gender:
- Male (n=733): 27%
- Female (n=774): 37%
Responses by household income:
- <$50,000 (n=334): 33%
- $50,000-$99,999 (n=341): 28%
- $100,000+ (n=199): 26%
Figure 28: Provide personal information for discount
Figure 28 illustrates the responses to the question GENERALLY, how likely or unlikely would you be to provide your personal information to an organisation if it meant you would receive discounted purchases? Out of a total 1507 respondents, the proportion likely to provide personal information for discount was 27%. The responses are broken down by age group, as follows:
- 18-24 (n=184): 56%
- 25-34 (n=289): 37%
- 35-49 (n=445): 25%
- 50+ (n=589): 15%
Figure 29: Provide personal information for service
Figure 29 illustrates the responses to the question GENERALLY, how likely or unlikely would you be to provide your personal information to an organisation if it meant you would receive more efficient and personalised service? Out of a total 1507 respondents, the proportion likely to provide personal information for more efficient and personalised service was 44%. The responses are broken down by age group, as follows:
- 18-24 (n=184): 66%
- 25-34 (n=289): 53%
- 35-49 (n=445): 44%
- 50+ (n=589): 32%
Figure 30: Provide personal information for discount or service
Figure 30 illustrates the responses to the question GENERALLY, how likely or unlikely would you be to provide your personal information to an organisation if it meant you would receive...
- discounted purchases?
- more efficient and personalised service?
It compares responses from 2001 and 2004.
| Response | 2004 (n=1,507) % | 2001 (n=1,524) % |
|---|---|---|
| Very likely | 7 | 6 |
| Quite likely | 21 | 26 |
| Neither likely nor unlikely | 5 | 11 |
| Quite unlikely | 27 | 29 |
| Very unlikely | 28 | 19 |
| Can’t say | 2 | 1 |
| Depends on organisation | 11 | 8 |
| Response | 2004 (n=1,507) % | 2001 (n=1,524) % |
|---|---|---|
| Very likely | 11 | 9 |
| Quite likely | 33 | 33 |
| Neither likely nor unlikely | 4 | 10 |
| Quite unlikely | 22 | 26 |
| Very unlikely | 19 | 14 |
| Can’t say | 2 | 2 |
| Depends on organisation | 9 | 6 |
Figure 32: Attitudes towards a unique identifier for all Australian Government departments
Figure 32 illustrates the responses to the question It has been suggested that each Australian should be given a unique number, like a tax file number, to be used for identification in ALL Commonwealth Government Departments, and to access government services on the Internet. In principle, are you in favour or against each Australian being given such a number? Out of a total 1507 respondents, 53% agreed and 41% disagreed. The chart is broken down by gender and household income.
| Response | Male (n=733) % | Female (n=774) % |
|---|---|---|
| Agree | 56 | 50 |
| Disagree | 40 | 42 |
| Response | <$50,000 (n=334) % | $50,000- $99,999 (n=341) % | $100,000+ (n=199) % |
|---|---|---|---|
| Agree | 53 | 61 | 61 |
| Disagree | 43 | 35 | 33 |
Figure 33: Circumstances under which government departments should be able to share information
Figure 33 illustrates the responses to the question Do you believe government departments should be able to cross-reference or share information in their databases for any purpose, some purposes, or not at all? The responses of the 1507 total respondents were as follows:
- Any purpose: 9%
- Some purposes: 62%
- Not at all: 24%
- Can’t say: 5%
Figure 34: Purposes for which government departments should be able to share information
Figure 34 illustrates the responses to the questions For which of the following purposes do you believe governments should be allowed to cross reference information? For updating basic information like address details? To solve or prevent fraud or other crime? To reduce costs, or improve efficiency? Out of the 1507 total respondents, 58% agreed with updating basic information, 68% agreed with preventing crime and 51% agreed with improving efficiency. The results are broken down by household income.
| Purpose | <$50,000 (n=334) % | $50,000- $99,999 (n=341) % | $100,000+ (n=199) % |
|---|---|---|---|
| Updating basic info | 56 | 66 | 69 |
| Prevent crime | 67 | 76 | 77 |
| Improve efficiency | 52 | 57 | 57 |
Figure 35: Attitudes towards doctors discussing patient details with other health professionals
Figure 35 illustrates the responses to the question Do you agree or disagree with the following statements? Your doctor should be able to discuss your personal medical details with other health professionals - in a way that identified you - WITHOUT YOUR CONSENT if they thought this would assist your treatment? It compares responses from 2004 and 2001.
| Response | 2004 (n=1,507) % | 2001 (n=1,524) % |
|---|---|---|
| Agree | 60 | 53 |
| Neither agree nor disagree | 1 | 4 |
| Disagree | 38 | 41 |
| Can’t say | 1 | 2 |
Figure 36: Attitudes towards doctors discussing patient details with other health professionals
Figure 36 illustrates the responses to the question Do you agree or disagree with the following statements? Your doctor should be able to discuss your personal medical details with other health professionals - in a way that identified you - WITHOUT YOUR CONSENT if they thought this would assist your treatment? The chart is broken down by gender, age and education. Of the total 1507 respondents, 60% agreed.
Responses by gender:
- Male (n=733): 65%
- Female (n=774): 57%
Responses by age:
- 18-24 (n=184): 56%
- 25-34 (n=289): 60%
- 35-49 (n=445): 57%
- 50+ (n=589): 65%
Responses by education:
- Some secondary school (n=111): 65%
- Degree from university or C.A.E (n=407): 52%
Figure 37: Attitudes towards a health number
Figure 37 illustrates the responses to the question Do you agree or disagree with the following statements? To enable the government to better track the use of HEALTH SERVICES, all individuals should be allocated a NUMBER and that number should be used when accessing ANY health service or facility. The chart is broken down by gender and age. Of the total 1507 respondents, 57% agreed.
Responses by gender:
- Male (n=733): 61%
- Female (n=774): 55%
Responses by age:
- 18-24 (n=184): 61%
- 25-34 (n=289): 50%
- 35-49 (n=445): 55%
- 50+ (n=589): 62%
Figure 38: Attitudes towards employers reading emails sent to employees’ work email accounts
Figure 38 illustrates the responses to the question For each of the following, could you tell me if you think it’s appropriate behaviour for an employer to do whenever they choose, only if they suspect wrong-doing or not at all. Read e-mails sent to a work email account. The chart is broken down by employment status. Of the total 1507 respondents, 23% responded whenever they chose, 38% responded only if they suspect wrong-doing, 34% responded not at all and 6% responded can’t say.
| Response | Total (n=1507) % | Total employed (n=1007) % | Total not employed (n=499) % |
|---|---|---|---|
| Whenever they choose | 23 | 24 | 20 |
| Only if they suspect wrong-doing | 38 | 39 | 35 |
| Not at all | 34 | 33 | 34 |
| Can’t say | 6 | 3 | 10 |
Figure 39: Attitudes towards employers using surveillance equipment to monitor the workplace
Figure 39 illustrates the responses to the question For each of the following, could you tell me if you think it’s appropriate behaviour for an employer to do whenever they choose, only if they suspect wrong-doing or not at all. Use surveillance equipment such as video and audio cameras to monitor the workplace. The chart is broken down by employment status. Of the total 1507 respondents, 21% responded whenever they chose, 40% responded only if they suspect wrong-doing, 35% responded not at all and 4% responded can’t say.
| Response | Total (n=1507) % | Total employed (n=1007) % | Total not employed (n=499) % |
|---|---|---|---|
| Whenever they choose | 21 | 21 | 20 |
| Only if they suspect wrong-doing | 43 | 42 | 44 |
| Not at all | 32 | 33 | 29 |
| Can’t say | 5 | 3 | 7 |
Figure 40: Attitudes towards employers using surveillance equipment to monitor the workplace
Figure 40 illustrates the responses to the question For each of the following, could you tell me if you think it’s appropriate behaviour for an employer to do whenever they choose, only if they suspect wrong-doing or not at all. Monitor everything an employee types into their computer, including what web sites they visit and what they type into emails. The chart is broken down by employment status. Of the total 1507 respondents, 21% responded whenever they chose, 43% responded only if they suspect wrong-doing, 32% responded not at all and 5% responded can’t say.
| Response | Total (n=1507) % | Total employed (n=1007) % | Total not employed (n=499) % |
|---|---|---|---|
| Whenever they choose | 21 | 21 | 20 |
| Only if they suspect wrong-doing | 43 | 42 | 44 |
| Not at all | 32 | 33 | 29 |
| Can’t say | 5 | 3 | 7 |
Figure 41: Attitudes towards employers monitoring employees’ telephone conversations
Figure 41 illustrates the responses to the question Listen to telephone conversations...Do you feel this is appropriate behaviour for an employer to do whenever they choose, FOR TRAINING AND QUALITY CONTROL, only if they suspect wrong-doing or not at all? The chart is broken down by employment status. Of the total 1507 respondents, 5% responded whenever they choose, 25% responded only if they suspect wrong-doing, 33% responded for training and quality control, 35% responded not at all and 2% responded can’t say.
| Response | Total employed (n=1007) % | Total not employed (n=499) % |
|---|---|---|
| Whenever they choose | 5 | 7 |
| Only if they suspect wrong-doing | 24 | 26 |
| For training and quality control | 34 | 30 |
| Not at all | 35 | 35 |
| Can’t say | 1 | 2 |
Figure 42: Attitudes towards random drug testing of employees
Figure 42 illustrates the responses to the question Randomly drug test employees...Do you feel this is appropriate behaviour for an employer to do whenever they choose, ONLY IF NECESSARY TO ENSURE SAFETY, or not at all. The chart is broken down by employment status. Of the total 1507 respondents, 23% responded whenever they choose, 59% responded only if necessary to ensure safety, 16% responded not at all and 2% responded can’t say.
| Response | Total employed (n=1007) % | Total not employed (n=499) % |
|---|---|---|
| Whenever they choose | 22 | 26 |
| Only if necessary to ensure safety | 61 | 54 |
| Not at all | 16 | 17 |
| Can’t say | 2 | 3 |
Figure 43: Attitudes towards employees having access to their personal employer files
Figure 43 illustrates the responses to the question Do you think that employees should have access to the information their employer holds about them? The chart is broken down by employment status. Of the total 1507 respondents, 85% responded yes, 12% responded no and 3% responded can’t say.
| Response | Total employed (n=1007) % | Total not employed (n=499) % |
|---|---|---|
| Yes | 87 | 79 |
| No | 11 | 16 |
| Can’t say | 2 | 5 |
Figure 44: Total proportion of respondents find employer privacy policy important
Figure 44 illustrates the responses to the question How important is it to you that an employer has a privacy policy that covers when they will read employee emails, randomly drug test employees, use surveillance equipment to monitor employees and listen to telephone conversations? The chart is broken down by employment status and education level. Of the total 1507 respondents, 83% agreed that privacy policies were important.
Responses by education level:
- Passed 4th Form / Year 10 (n=225): 76%
- Degree from University or C.A.E (n=407): 91%
Responses by employment status:
- Total employed (n=1007): 86%
- Total not employed (n=499): 77%
Figure 45: Concerns over the security of personal details online
Figure 45 illustrates the responses to the question GENERALLY, when dealing over the internet, would you say you have MORE CONCERNS about the security of your personal details than usual, FEWER concerns or about the same? The chart compares responses from 2001 and 2004.
| Response | 2001 % | 2004 % |
|---|---|---|
| More concerns | 57 | 62 |
| Fewer concerns | 8 | 5 |
| About the same | 31 | 30 |
| Can’t say | 4 | 3 |
Figure 47: Measures taken to protect home PC
Figure 47 illustrates the responses to the question Which of the following do you currently have on your home computer? There were 1,001 respondents, that is, the total number of respondents who had a home computer.The responses were as follows:
- Regularly update antivirus software: 80%
- Use a firewall: 49%
- Ever reject cookies: 48%
- Use a spam filter: 47%
- Use temporary email accounts: 38%
- Use software to protect anonymity: 28%
Footnotes
[1] Source: The Office of the Federal Privacy Commissioner website www.privacy.gov.au/about/complaints/index_print.html
[2] Mary J Culnan and George R Milne, The Culnan Milne Survey on Consumers & Online Privacy Notices: Summary of responses December 2001, University of Massachusetts; See also http://www.cdt.org/privacy/ccp/notice1.shtml; Joseph Turow, Americans & Online Privacy: The System is Broken: A Report from the Annenberg Public Policy Center for the University of Pennsylvania June 2003. More information is available at http://www.privacyconference2003.org/resolution.asp


