
Routine system maintenance: the OAIC’s online forms may be unavailable between 07:00am and 11:30am on Sunday 21 June 2026.

  • On this page

Trust in organisations to protect and use personal information varies markedly by sector, with strongest confidence in essential and public-facing services such as health, government and financial institutions. Weaker trust was recorded in commercial, digital and data-driven industries including AI, social media companies and data brokers. At the same time, Australians are becoming more selective about what personal information they consider fair to share, generally limiting acceptance to basic details and situations where there are a clear purpose and a trusted context.

This cautious approach also extends to government data use, where Australians are more comfortable when information is used to deliver services or public benefit, but less accepting of practices that lack transparency, involve identifiable data, or are not clearly communicated, highlighting the importance of trust, purpose and control.

Trustworthiness of organisations by sector

Trust in organisations to protect and appropriately use personal information varies markedly by sector.

Health service providers are the most trusted industry sector, with 74% of Australians viewing them as trustworthy. Trust is also higher for sectors linked to public services and regulated handling of personal information, including:

  • government agencies (68%)
  • financial institutions (59%)
  • education providers (57%, down from 61% in 2023).

Trust is more mixed across some commercial sectors, with confidence declining over time in several industries:

  • insurance companies (28%, down from 40% in 2023)
  • telecommunications providers (24%, down from 37% in 2023)
  • technology companies (17%, less than half of 39% in 2023).
  • real estate agencies (13%, nearly half of 23% in 2023)
  • retailers (10%, around a third of 30% in 2023).

The lowest levels of trust are reported for data-driven sectors whose core activities involve large-scale data collection and analysis:

  • data brokers (4%)
  • AI companies (4%)
  • social media companies (3%, down from 14% in 2023).

Trust and distrust also vary across population groups:

  • Australians aged 65 and over are more likely than those aged 18–64 to trust telecommunications providers (35% vs 21%).
  • Men are more likely than women to view data brokers (78% vs 69%), real estate agencies (66% vs 57%), and insurance companies (44% vs 37%) as untrustworthy, while women are more likely than men to trust education providers (61% vs 53%).

Figure 13 Trust in organisations to protect and use personal information

A grouped stacked bar chart shows trust in organisations to protect and use personal information, comparing 2020, 2023 and 2026 data. Health service providers: Very trustworthy 25%, Somewhat trustworthy 48%, Neither trustworthy nor untrustworthy 17%, Somewhat untrustworthy 7%, Very untrustworthy 2% (2026); 70% (2020), 74% (2023), 74% (2026) very/somewhat trustworthy. Government agencies: Very trustworthy 24%, Somewhat trustworthy 45%, Neither trustworthy nor untrustworthy 17%, Somewhat untrustworthy 8%, Very untrustworthy 7% (2026); 51% (2020), 67% (2023), 68% (2026) very/somewhat trustworthy. Financial institutions: Very trustworthy 16%, Somewhat trustworthy 43%, Neither trustworthy nor untrustworthy 20%, Somewhat untrustworthy 13%, Very untrustworthy 7% (2026); 50% (2020), 61% (2023), 59% (2026) very/somewhat trustworthy. Education providers: Very trustworthy 10%, Somewhat trustworthy 47%, Neither trustworthy nor untrustworthy 29%, Somewhat untrustworthy 10%, Very untrustworthy 4% (2026); not applicable (2020), 61% (2023), 57% (2026) very/somewhat trustworthy. Insurance companies: Very trustworthy 3%, Somewhat trustworthy 25%, Neither trustworthy nor untrustworthy 32%, Somewhat untrustworthy 23%, Very untrustworthy 17% (2026); 35% (2020), 40% (2023), 28% (2026) very/somewhat trustworthy. Telecommunications providers: Very trustworthy 2%, Somewhat trustworthy 22%, Neither trustworthy nor untrustworthy 26%, Somewhat untrustworthy 31%, Very untrustworthy 19% (2026); 37% (2020), 35% (2023), 24% (2026) very/somewhat trustworthy. Technology companies: Very trustworthy 1%, Somewhat trustworthy 15%, Neither trustworthy nor untrustworthy 23%, Somewhat untrustworthy 30%, Very untrustworthy 30% (2026); 21% (2020), 39% (2023), 17% (2026) very/somewhat trustworthy. Real estate agencies: Very trustworthy less than 0.5%, Somewhat trustworthy 13%, Neither trustworthy nor untrustworthy 25%, Somewhat untrustworthy 33%, Very untrustworthy 29% (2026); N/A (2020), 23% (2023), 13% (2026) very/somewhat trustworthy. Retailers (including online retailers): Very trustworthy less than 0.5%, Somewhat trustworthy 9%, Neither trustworthy nor untrustworthy 28%, Somewhat untrustworthy 37%, Very untrustworthy 24% (2026); 24% (2020), 30% (2023), 10% (2026) very/somewhat trustworthy. Data brokers: Very trustworthy 1%, Somewhat trustworthy 4%, Neither trustworthy nor untrustworthy 22%, Somewhat untrustworthy 26%, Very untrustworthy 47% (2026); not applicable (2020), 33% (2023), 4% (2026) very/somewhat trustworthy. AI companies: Very trustworthy less than 0.5%, Somewhat trustworthy 4%, Neither trustworthy nor untrustworthy 18%, Somewhat untrustworthy 29%, Very untrustworthy 49% (2026); not applicable (2020), not applicable (2023), 4% (2026) very/somewhat trustworthy. Social media companies: Very trustworthy less than 0.5%, Somewhat trustworthy 3%, Neither trustworthy nor untrustworthy 11%, Somewhat untrustworthy 27%, Very untrustworthy 59% (2026); 11% (2020), 14% (2023), 3% (2026) very/somewhat trustworthy.

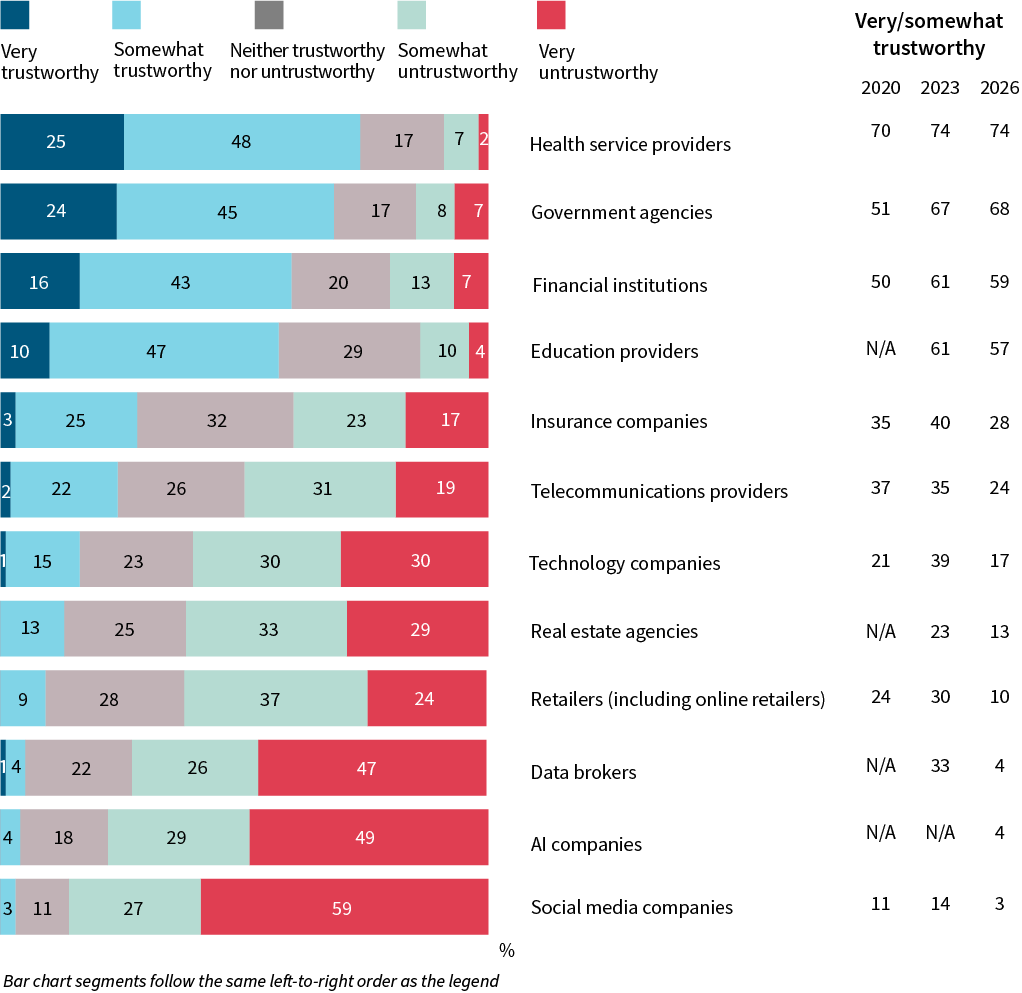
F1. Thinking now about trustworthiness, how trustworthy would you say the following organisations are with regard to how they protect and use your personal information?

Base: All Australians aged 18+. (2026: n=1,504, 2023: n=1,642, 2020: n=1,505)

Notes: Don’t know (all <1%) and refused (all <0.5%) not displayed. “Credit reporting bodies (e.g. Equifax, Illion, Experian)” label was updated to “Data brokers (e.g. Acxiom, Experian Marketing Services, Quantium, companies that buy and sell consumer data)” in 2026, so comparisons with 2023 should be interpreted with caution.

Expectations of fair and reasonable data collection by sector

Respondents were shown a list of different types of personal information and asked what they considered fair and reasonable to provide when accessing services in specific sectors. Compared with 2023, the proportion of Australians who say none of the listed types of personal information are fair and reasonable to provide has doubled (12%, up from 6%), suggesting growing caution about sharing personal information when accessing services across industries.

Australians are most likely to consider basic contact and identity information fair and reasonable to provide, including:

  • email address (85%)
  • name (85%, down from 90% in 2023)
  • phone number (78%, down from 82%)
  • date of birth and address (both 72%, down from 78%)
  • identification documents (e.g. driver’s license, passport) (52%).

Acceptance has declined for the collection of more sensitive or behavioural data:

  • data on how they access, use or interact with services (35%)
  • marital status (32%, down from 38%)
  • Medical or health information (31%)
  • financial information (29%, up from 25%)
  • location data (28%).

The lowest levels of acceptance are for highly sensitive or intrusive data, including:

  • sexual orientation and biometric information (e.g. fingerprints, facial images) (both 11%)
  • social media identifiers (e.g. profile links, usernames, social media activity) (10%)
  • religion (9%)
  • behavioural or psychological data about interests, habits, likes and dislikes (8%)
  • detailed website or app tracking data (e.g. pages viewed, clicks, browsing behaviour across sites) (7%).

Men are more likely than women to consider biometric information being fair and reasonable to provide (14% vs 8%). Younger Australians aged 18–24 are more likely to view social media identifiers as acceptable (24% vs 8% of those aged 25+), while those aged 65+ are more likely to consider location data fair and reasonable (38% vs 25% of those aged 18–24).

Across sectors, basic contact and identity information, such as email address and name, are the most widely accepted data types to provide, particularly for financial institutions, Government agencies and health service providers, where additional information such as phone number and date of birth are also commonly seen as reasonable, and more sensitive data aligns with context (e.g. financial information for banks and health information for healthcare providers). Telecommunications and insurance providers follow a similar but slightly lower pattern, with strong acceptance of core details but more limited acceptance of sensitive data. In contrast, retailers and real estate agencies see lower acceptance beyond basic contact information, while technology companies and social media platforms have the narrowest acceptance overall, with users largely restricting what they consider reasonable to share and showing comparatively higher resistance across most data types.

Figure 14 Information considered fair and reasonable to provide when accessing services by industry sector

A heatmap chart shows what information is considered fair and reasonable to provide when accessing services, by industry sector, in 2026. Financial institutions: Email address 89%, Name 89%, Phone number 86%, Date of birth 83%, Address 83%, Identification documents 71%, Data on how I access, use or interact with their service 39%, Marital status 38%, Medical or health information 23%, Information about my finances 61%, Location data 28%, Household composition 25%, Sexual orientation 9%, Biometric information 20%, Social media identifiers 9%, Religion 7%, Behavioural or psychological data about my interests, habits, likes and dislikes 8%, Detailed website or app tracking 5%, None of the above 8%. Federal government agencies: Email address 88%, Name 91%, Phone number 83%, Date of birth 89%, Address 86%, Identification documents 75%, Data on how I access, use or interact with their service 41%, Marital status 56%, Medical or health information 37%, Information about my finances 39%, Location data 27%, Household composition 36%, Sexual orientation 13%, Biometric information 15%, Social media identifiers 10%, Religion 15%, Behavioural or psychological data about my interests, habits, likes and dislikes 5%, Detailed website or app tracking 5%, None of the above 12%. Health service providers: Email address 86%, Name 90%, Phone number 87%, Date of birth 89%, Address 81%, Identification documents 56%, Data on how I access, use or interact with their service 37%, Marital status 39%, Medical or health information 88%, Information about my finances 21%, Location data 31%, Household composition 22%, Sexual orientation 26%, Biometric information 12%, Social media identifiers 7%, Religion 17%, Behavioural or psychological data about my interests, habits, likes and dislikes 15%, Detailed website or app tracking 5%, None of the above 7%. Retailers: Email address 84%, Name 78%, Phone number 72%, Date of birth 61%, Address 69%, Identification documents 41%, Data on how I access, use or interact with their service 34%, Marital status 24%, Medical or health information 21%, Information about my finances 21%, Location data 23%, Household composition 21%, Sexual orientation 9%, Biometric information 7%, Social media identifiers 7%, Religion 6%, Behavioural or psychological data about my interests, habits, likes and dislikes 9%, Detailed website or app tracking 9%, None of the above 13%. Social media companies: Email address 80%, Name 81%, Phone number 66%, Date of birth 66%, Address 54%, Identification documents 34%, Data on how I access, use or interact with their service 33%, Marital status 25%, Medical or health information 18%, Information about my finances 21%, Location data 24%, Household composition 21%, Sexual orientation 12%, Biometric information 10%, Social media identifiers 27%, Religion 9%, Behavioural or psychological data about my interests, habits, likes and dislikes 10%, Detailed website or app tracking 9%, None of the above 22%. Telecommunications providers: Email address 87%, Name 85%, Phone number 86%, Date of birth 69%, Address 74%, Identification documents 51%, Data on how I access, use or interact with their service 35%, Marital status 22%, Medical or health information 20%, Information about my finances 21%, Location data 35%, Household composition 17%, Sexual orientation 7%, Biometric information 8%, Social media identifiers 8%, Religion 6%, Behavioural or psychological data about my interests, habits, likes and dislikes 7%, Detailed website or app tracking 8%, None of the above 8%. Technology companies: Email address 82%, Name 81%, Phone number 69%, Date of birth 62%, Address 61%, Identification documents 35%, Data on how I access, use or interact with their service 35%, Marital status 24%, Medical or health information 20%, Information about my finances 17%, Location data 27%, Household composition 16%, Sexual orientation 11%, Biometric information 11%, Social media identifiers 13%, Religion 9%, Behavioural or psychological data about my interests, habits, likes and dislikes 11%, Detailed website or app tracking 8%, None of the above 14%. Insurance companies: Email address 87%, Name 86%, Phone number 80%, Date of birth 76%, Address 74%, Identification documents 54%, Data on how I access, use or interact with their service 35%, Marital status 31%, Medical or health information 41%, Information about my finances 26%, Location data 30%, Household composition 29%, Sexual orientation 7%, Biometric information 8%, Social media identifiers 6%, Religion 6%, Behavioural or psychological data about my interests, habits, likes and dislikes 7%, Detailed website or app tracking 5%, None of the above 8%. Real estate agencies: Email address 82%, Name 81%, Phone number 76%, Date of birth 60%, Address 65%, Identification documents 48%, Data on how I access, use or interact with their service 31%, Marital status 30%, Medical or health information 18%, Information about my finances 31%, Location data 27%, Household composition 31%, Sexual orientation 7%, Biometric information 7%, Social media identifiers 6%, Religion 9%, Behavioural or psychological data about my interests, habits, likes and dislikes 4%, Detailed website or app tracking 7%, None of the above 15%.

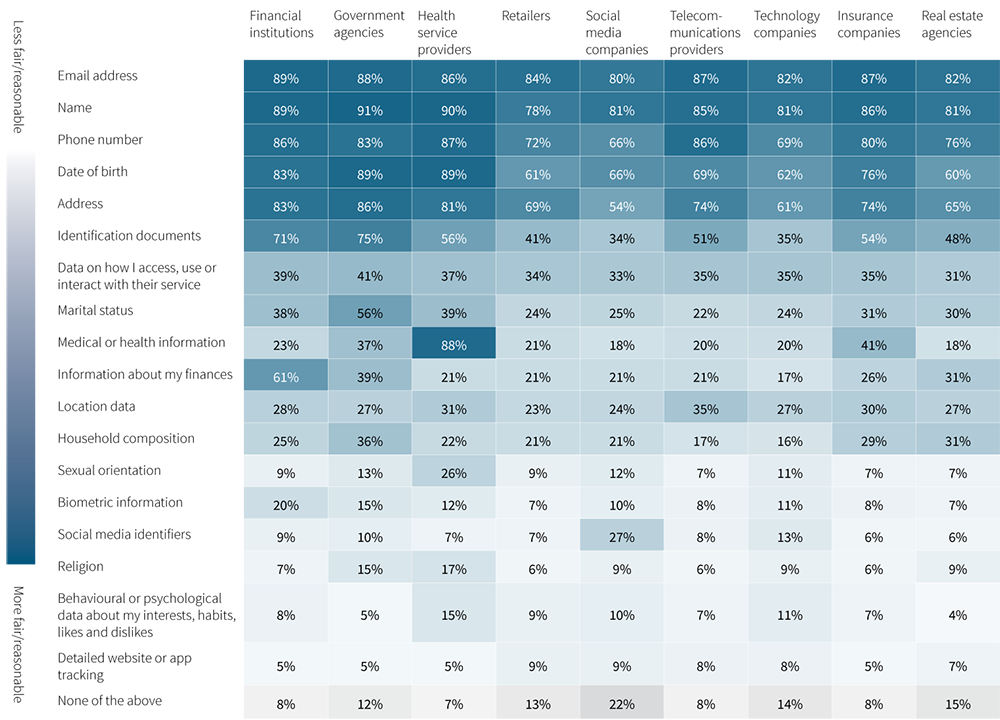
F2. What information would you consider to be fair and reasonable to provide to when accessing their services? (Merged F2A, F2B)

Base: Financial institutions (n=339), government agencies (n=322), Health service providers (n=330), Retailers (n=336), Social media companies (n=333), Telecommunications providers (n=335), Technology companies (n=328), Insurance companies (n=342), Real estate agencies (n=343).

Notes: Prefer not to say (0%) and unsure (all <0.5%) not displayed.

Comfort with government use of personal information and data linking

Australians are more comfortable with cross agency data use when it is framed around service delivery, improvement, safety, or deidentification. Australians are more likely to feel comfortable or very comfortable with:

  • sharing information with another agency to deliver a requested service (64%)
  • agencies link information across departments to improve services (59%)\
  • linking information to detect fraud or unlawful activity (56%)
  • linking information to be used in a deidentified form (55%).

Comfort declines when the purpose is research or policy development, with only 36% feeling comfortable. Views are more divided in this context, suggesting uncertainty or mixed acceptance when data use is less directly connected to immediate personal benefit, public good or clear protections. Australians are least comfortable with practices that reduce transparency or increasing identifiability:

  • Only one-quarter (24%) are comfortable with government agencies linking information in a way that identifies them personally.
  • 72% feeling uncomfortable when linking occurs without directly informing the individual at the time.

Figure 15 Comfort with government agencies’ use of personal information

A grouped stacked bar chart shows comfort with government agencies’ use of personal information, based on 2026 data. One government agency sharing my personal information with another agency to deliver a service I have requested: Very comfortable 19%, Somewhat comfortable 46%, Neither comfortable nor uncomfortable 19%, Somewhat uncomfortable 11%, Very uncomfortable 6% (2026); 64% very/somewhat comfortable. Government agencies linking my information across departments (e.g. tax, health, education, welfare) to improve services: Very comfortable 15%, Somewhat comfortable 45%, Neither comfortable nor uncomfortable 20%, Somewhat uncomfortable 13%, Very uncomfortable 7% (2026); 59% very/somewhat comfortable. Government agencies linking my information to detect fraud or unlawful activity: Very comfortable 17%, Somewhat comfortable 39%, Neither comfortable nor uncomfortable 22%, Somewhat uncomfortable 14%, Very uncomfortable 8% (2026); 56% very/somewhat comfortable. Government agencies linking my information in a de-identified form (where my name and direct identifiers are removed): Very comfortable 18%, Somewhat comfortable 37%, Neither comfortable nor uncomfortable 24%, Somewhat uncomfortable 14%, Very uncomfortable 7% (2026); 55% very/somewhat comfortable. Government agencies linking my information for research or policy development purposes: Very comfortable 6%, Somewhat comfortable 30%, Neither comfortable nor uncomfortable 28%, Somewhat uncomfortable 25%, Very uncomfortable 11% (2026); 36% very/somewhat comfortable. Government agencies linking my information in a way that identifies me personally: Very comfortable 4%, Somewhat comfortable 20%, Neither comfortable nor uncomfortable 23%, Somewhat uncomfortable 27%, Very uncomfortable 26% (2026); 24% very/somewhat comfortable. Government agencies linking my information without directly informing me at the time: Very comfortable 3%, Somewhat comfortable 10%, Neither comfortable nor uncomfortable 16%, Somewhat uncomfortable 35%, Very uncomfortable 37% (2026); 12% very/somewhat comfortable.

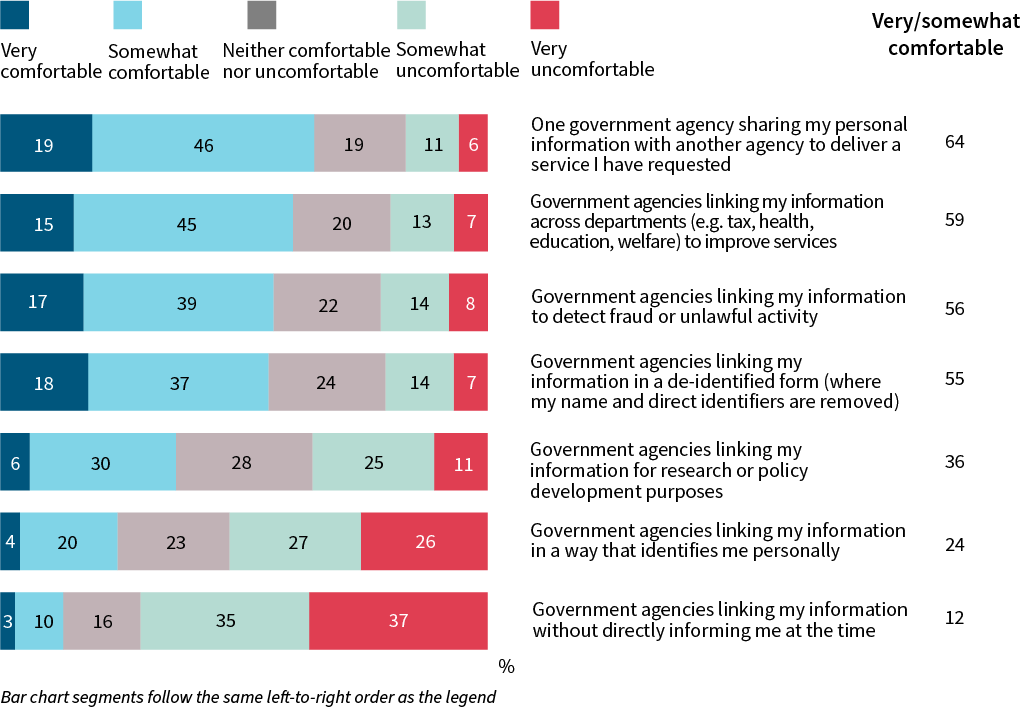
F7. How comfortable are you with the following uses of your personal information by government agencies?

Base: All Australians aged 18+. (n=1,504)

Notes: Don’t know (all <0.5%) and refused (0%) not displayed.