-
On this page
1.0 Executive summary
Wallis Consulting Group was commissioned by the Office of the Privacy Commissioner, Australia (the Office) to conduct the 2007 Community Attitudes Towards Privacy Study. The study aims to understand Australians’ changing awareness and opinions about privacy laws, how they apply to government and business and how individuals view a range of emerging issues, in particular, identity fraud and theft and the use of closed circuit television.
As was the case in previous studies undertaken by the Office in 2001 and 2004, the 2007 study was conducted by telephone. 1503 respondents were selected at random from an electronic listing of home telephone numbers. Quotas were placed on the number of interviews conducted by age and location and the data set was then weighted to reflect the characteristics of the adult Australian population as measured in the 2006 Census by the Australian Bureau of Statistics.
In comparison with 2004, community attitudes have changed significantly in the following areas:
Public trust in the ability of organisations to handle personal information appropriately has increased for health service providers, and Government departments. It has declined for financial institutions and has remained stable for charities, retailers, market research organisations and businesses selling over the Internet.
An increasing proportion of Australians are willing to provide a wide range of personal information to organisations. Whereas, in 2004, 58% were reluctant to provide financial information, now only 43% are reluctant. While the proportion of respondents reluctant to divulge their financial details in general has declined, the proportion saying they are most reluctant to release salary details has doubled to 18%.
One of the largest changes is the fall in the proportion of Australians who say they are reluctant to disclose health information. Only 6% of Australians are reluctant to provide this information now, compared with 21% in 2004.
The reasons Australians are reluctant to release information remain the same - most feel that organisations have no right to know this information or that it might lead to unwelcome unsolicited direct marketing activity by mail or telephone. A smaller proportion is concerned that providing this information may lead to financial loss via unsolicited access of their bank accounts or other crime.
The proportion of Australians willing to provide personal information if they have a chance of gaining a discount declined. Now 22% say they are likely to give personal information for a discount, compared with 28% in 2004. Only 14% of Australians would be motivated to give information in exchange for a prize.
There has been a slight increase, to 36%, of respondents who have decided not to deal with a business or charity because of concerns over the way that organisation might handle their personal information. The proportion that has avoided Government departments on the same grounds (12%) is lower than when measured in 2004 (16%).
The number of people who believe the Electoral Roll should not be used for marketing purposes has increased from 77% in 2004 to 82% in 2007. Support for using the White Pages for marketing purposes is increasing, with 46% in favour. While the increase is not significant compared with 2004, it is when compared with 2001 when 42% agreed. Nonetheless, 50% do not agree with using the White Pages for marketing purposes.
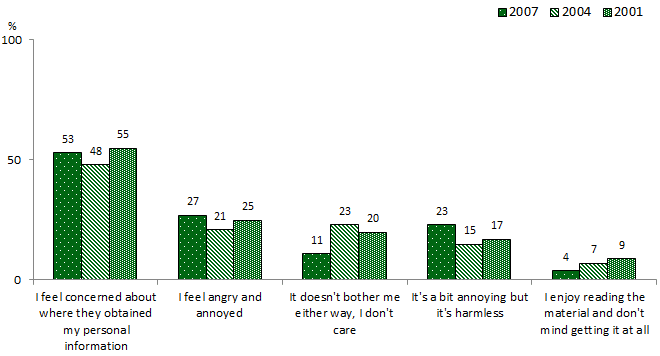
The community’s reactions to being sent unsolicited marketing information are gradually becoming less favourable. Receiving this material continues to cause 53% of recipients to wonder from where the sender obtained their details. An increasing proportion, currently standing at 27%, feel angry and annoyed by it. Only 4% welcome its arrival and enjoy reading it compared with 7% in 2004 and 9% in 2001.
Community support for a unique identifying number to be used by Australians accessing Government services has increased in the last three years to 62% (up from 53% in 2004). Support for Government departments being able to cross reference or share information has increased from 71% in 2004 to 80%. Australians support sharing information most if it is for the purpose of solving fraud or other crime (77%), or for updating information (67%). When asked if they considered it appropriate to share information on the grounds of increased efficiency, 49% agreed.
Seventy six percent (76%) of Australians felt that inclusion in a national health database should be voluntary compared with 64% in 2004. The community was evenly divided on whether or not de-identified information from this database should be made available for research purposes.
Fifty percent of respondents said they were more concerned about providing information over the Internet than they were two years ago. Generally speaking, the community is more concerned about providing information over the Internet than in hard copy format or over the telephone. Despite this, 67% of Australians claimed not to provide false information over the Internet in order to protect their privacy.
- Australians are now more aware both of the existence of privacy laws and of the Office. Sixty nine percent (69%) of Australians are aware of the laws now (up 10%) and 45% are aware of the Commissioner (compared with 34% three years ago). However, the community remains unsure as to the extent of coverage of the Privacy Act, with most correctly nominating that it covers government and big business. Significant proportions also believe it applies to state government, small businesses and businesses domiciled overseas. The majority correctly believes that the Act relates to correct handling of personal information. Over half also believe that some matters relating to personal privacy, for example their neighbours spying, are also included.
In general terms, attitudes were stable regarding matters relating to privacy in the workplace and the release of medical details. In particular:
Eighty six percent (86%) of Australians continue to think that employees should have access to information that employers keep about them. Most also believe that employers are entitled to monitor employees’ emails, computers, telephone conversations and their whereabouts, as well as undertaking surveillance activities and random drug and alcohol testing in certain circumstances – especially where wrongdoing is suspected, for the safety and security of employees or, in the case of monitoring telephone conversations, for the purposes of training and quality control. Depending on the activity, between 20% and 30% of Australians believe that employers should not be able to undertake these at all.
Sixty percent (60%) of Australians continue to support their doctor discussing their own personally identified medical details with other health professionals.
However on the subject of informing relatives about the presence of a genetic illness – a new area of investigation for this survey – a slim majority (55%) believes that this should be done without the patient’s consent. Of these, 36% believe this should be done only if there is a strong possibility that the relative may have the illness, and 19% think it should be done irrespective of the likelihood of the illness being inherited. Forty three percent believe relatives should only be told if the patient consents to it.
Other new topics were discussed with respondents in this study:
The majority of Australians (90%) are concerned about businesses sending their personal information overseas, with 63% being very concerned.
While 9% claim to have been the victim of identity fraud or theft, 17% claim to know someone who has been. People aged between 35 and 49 are the most likely to have been the victim or know someone who has been. Western Australians also displayed a significantly higher incidence (14%) of being a victim than others. This question was also included in the Verification Study conducted by NewsPoll and exactly the same results were obtained. Sixty percent (60%) of Australians are concerned that they may become a victim.
The most likely way that identity fraud and theft can occur is considered to be the Internet – a view held by 45% of the community. Losing identifying documentation through carelessness or theft, or losing sight of credit cards are also considered to be major contributors.
Over 80% of Australians believe it is reasonable to show identifying documentation to gain access to licenced premises, but only 18% think it is reasonable to have their documentation copied. Support is high for showing documentation to obtain a credit card (96%), and to purchase goods for which an individual must be aged over 18 (93%). While 57% still think it reasonable to have identifying documents copied in order to obtain a credit card, support drops to less than 23% in the other cases.
Most Australians are aware of CCTV and the majority is not concerned about its use. Concerns mostly relate to the potential misuse of captured footage and a perceived invasion of privacy. Even those who were concerned suggested people and organisations who should have access to the footage and places where they felt it appropriate for CCTV cameras to be placed. Amongst those aware of cameras, 88% felt it reasonable for the police to have access to footage. Other organisations received lower levels of support for having access, with 20% nominating security companies, 15% the government, 13% anti-terrorist agencies and 11% the company that installed the camera.
While 9% of Australians were happy to have CCTV cameras placed anywhere (with the exception of public toilets and changing rooms), the majority are happy with public places. Private institutions including banks, entertainment venues, pubs and clubs were nominated by 29%. Of the people aware of CCTV cameras, 8% supported placing cameras in public institutions including government offices, hospitals, schools and police stations.
2.0 Background information
The Office of the Privacy Commissioner, Australia (the Office) is an independent statutory body that operates with the purpose of promoting and protecting privacy in Australia. The Office has responsibilities under the Privacy Act 1988 for the protection of individuals’ personal information handled by Australian and ACT Government departments, large businesses and some small businesses. Australian and ACT Government departments have been covered by the Information Privacy Principles since 1989 and most private sector organisations have been covered by the National Privacy Principles since 2001.
The Office has undertaken regular studies to understand community attitudes towards privacy in Australia since the early nineties. The two most recent studies, conducted in 2001 and 2004[1], adopted very similar lines of questioning and, with the extension of the Privacy Act to include the private sector, sought to understand public awareness of the legislation and its rights under it. In 2001 the key focus of the study was to provide information about community attitudes towards privacy generally. The focus shifted in 2004 to provide input into a review of the private sector provisions of the Privacy Act.
2.1 Research objectives
The principal research objectives of the 2007 Community Attitudes Survey are to gauge public opinion and awareness on a range of issues relating to the use and handling of personal information by business and government organisations.
The objectives for the 2007 study are:
To provide input into the Office’s response to the Australian Law Reform Commission’s forthcoming Discussion Paper on its review into privacy legislation.
To assist in the Office’s policy and compliance work, particularly in informing thinking on various issues.
To inform the Office’s communications work, particularly in identifying issues and audiences that require a focussed response or level of pro-activity in terms of the Office’s educational work.
To provide information on privacy trends and developments for the Office’s stakeholders.
To track changes in community attitudes since the last research and to use this information as a benchmark for future studies.
3.0 Methodology
Data for this study was collected through Computer Assisted Telephone Interviewing between 11 July and 7 August 2007. All calls were made from Wallis Consulting Group’s Telephone interviewing facility in Melbourne. In total 1503 interviews were completed with a representative sample of Australians. In order to ensure that the responses of younger Australians could be compared with those aged over 25, this population group was over sampled. The data was then weighted to match 2006 Australian Bureau of Statistics population Census data on the basis of age, sex and location of respondents. The interview took, on average, 27 minutes for respondents to complete. The questionnaire used is found at Appendix 2. The full methodology used to conduct this study is published separately.
Table 1. Number of interviews completed by age, sex and location.
| Sex | Age | Total | SYD | NSW/ ACT | MEL | VIC | BRIS | QLD | ADEL | SA/ NT | PERTH | WA | TAS |
|---|---|---|---|---|---|---|---|---|---|---|---|---|---|
| Male | 18-24 | 74 | 12 | 13 | 27 | 3 | 8 | 4 | 3 | 0 | 3 | 0 | 1 |
| Male | 35-49 | 194 | 55 | 29 | 34 | 12 | 11 | 19 | 6 | 7 | 11 | 5 | 5 |
| Male | 50+ | 245 | 51 | 36 | 24 | 22 | 20 | 25 | 20 | 10 | 24 | 7 | 6 |
| Female | 18-24 | 91 | 15 | 10 | 29 | 1 | 8 | 11 | 4 | 0 | 10 | 3 | 0 |
| Female | 25-34 | 222 | 45 | 29 | 50 | 11 | 24 | 25 | 8 | 5 | 14 | 5 | 6 |
| Female | 50+ | 288 | 47 | 46 | 34 | 20 | 24 | 28 | 30 | 13 | 23 | 10 | 13 |
| Total | 1503 | 315 | 210 | 270 | 90 | 135 | 150 | 90 | 48 | 105 | 45 | 45 | |
In addition to the main study a verification study was conducted in which three questions from the main study were asked on the NewsPoll Omnibus and the results compared. The results from this study are included at Appendix 1.
4.0 Detailed findings
This report provides a descriptive analysis of each survey question and includes comparisons to the previous community attitudes to privacy survey results (2001, 2004 and studies undertaken in the early 1990s) where applicable. Results shown are by age, gender, location, combined household income, highest achieved level of education and occupation, where significant differences in opinion occurred. Differences noted are significant to the 95% confidence limit.
The topics examined in this survey include:
- Community knowledge and awareness of privacy issues
- Trust in organisations’ handling of personal information
- Attitudes towards business’ handling of personal information
- Attitudes towards government departments’ handling of personal information
- Health services and privacy
- Privacy in the workplace
- Privacy and the Internet
- Identity fraud and theft
- Privacy in public places – closed circuit television (CCTV)
5.0 Community knowledge
In order to protect Australians’ personal information it is important that the community know that they have rights pertaining to the handling and use of their personal information, that they know what those rights are and how to exercise them. The extent to which the community is aware of these fundamental aspects of privacy is addressed in this section.
Community knowledge of privacy laws was ascertained, as in previous surveys, by asking respondents questions about their awareness of their existence; whether they were aware that there is a Federal Privacy Commissioner; where they would go to report misuse of their personal information; whether certain organisations are bound by Privacy Laws; and, additionally in 2007, whether or not they considered certain activities to be contraventions of the Privacy Act 1988.
5.1 Awareness of federal privacy laws
Sixty-nine percent of respondents said they were aware that Federal privacy laws existed. Awareness has almost doubled since first measured in 1994 (36%). They have increased significantly every time they have been measured since (43% in 2001, 60% in 2004).
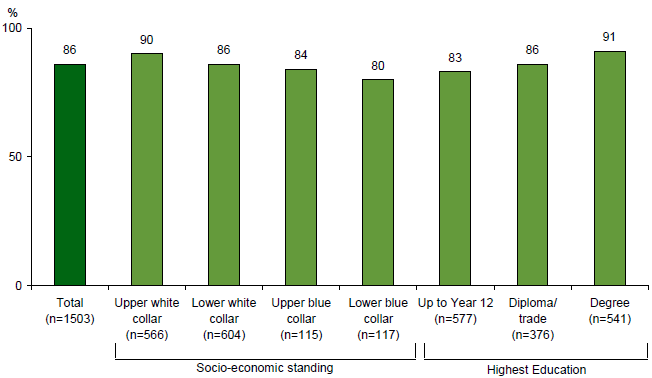
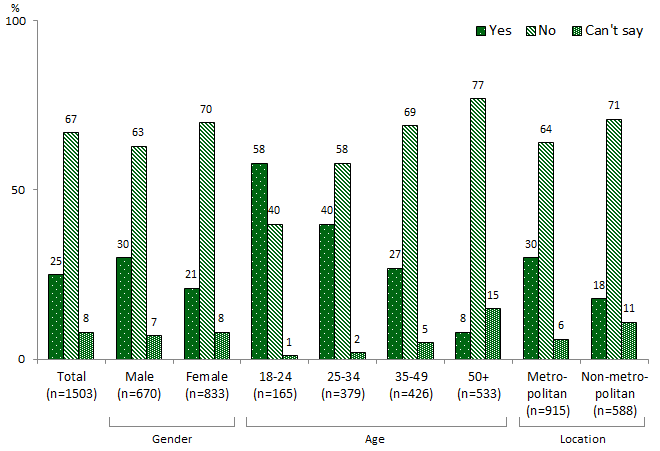
Chart 1 and Table 2 demonstrate that:
Increases in awareness occurred in all states in comparison to 2004. Western Australia continued to record significantly lower levels of awareness at 58% compared to other states.
Younger respondents continue to be less aware of privacy laws than older respondents. Those aged 18-24 (50%) had similar levels of awareness to those recorded in 2004 (48%), while awareness amongst other age groups continued to increase.
Respondents who had achieved higher levels of education were more likely to be aware of the privacy laws. For example 59% of people educated up to Year 12 were aware, compared with 80% of people who are tertiary educated.
Chart 1. Awareness of federal privacy laws
Q. Were you aware of the federal PRIVACY LAWS before this interview?
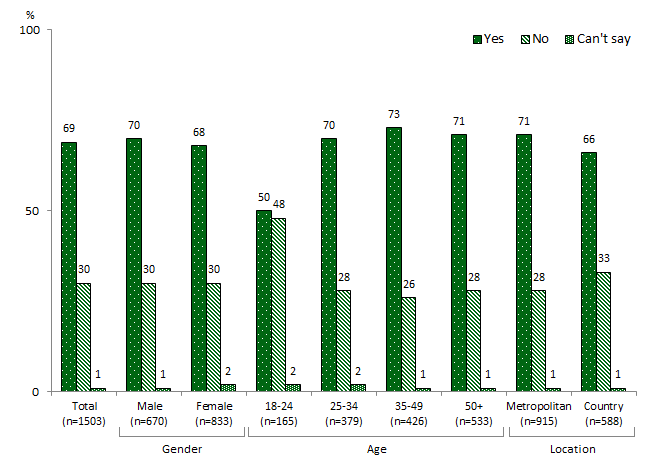
Base: All respondents (n=1503)
Table 2. Awareness of federal privacy laws by state
| 2001 (n=1524) % | 2004 (n=1507) % | 2007 (n=1503) % | |
|---|---|---|---|
| NSW | 44 | 61 | 71 |
| VIC | 40 | 63 | 70 |
| QLD | 43 | 59 | 69 |
| WA | 51 | 51 | 58 |
| SA[*]/NT | 38[*] | 61 | 69 |
| TAS | 42 | 63 | 66 |
[*] SA only, awareness in NT was 40%
Base sizes vary within each state by year
Bold indicates a significant increase on the previous year
5.2 Awareness of the Privacy Commissioner
Awareness of the Privacy Commissioner continues to increase. It now stands at 45% of Australians saying they are aware, in comparison with 36% in 2001 and 34% in 2004. Awareness is highest in Victoria (49%), Tasmania (49%), NSW (48%), South Australia (46%) and the Northern Territory (46%) and at the same lowest level in Western Australia and Queensland (both 36%). In 2004 in South Australia and the Northern Territory, awareness was lower relative to the other states, however, awareness is now on par with the national average.
Respondents who live in metropolitan areas (48%) were more likely to be aware than those living elsewhere (40%). Awareness increases with increasing age (see Chart 2).
Chart 2. Awareness of Federal Privacy Commissioner
Q. Are you aware that a Federal Privacy Commissioner exists to uphold privacy laws and to investigate complaints people may have about the misuse of their personal information?
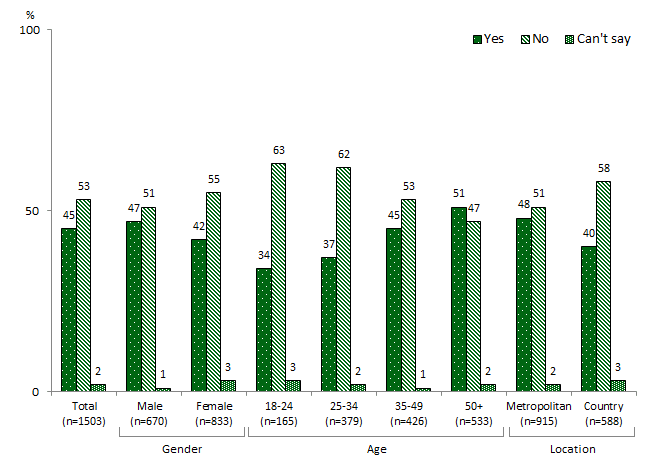
Base: All respondents (n=1503)
5.3 Reporting misuse of personal information
Respondents were asked who they would contact if they wanted to report misuse of their personal information. The results indicate increasing confidence in knowing how to make a report, demonstrated by the lower proportion unable to name an appropriate person or organisation. Nonetheless, 20% (down from 29% in 2004) could not answer the question.
The police were mentioned by 30% as the organisation they would contact. This is a significant increase compared with 2004 when 13% nominated the police. The Ombudsman was mentioned by 19%, and 13% said they would go to the organisation involved. One in ten (10%) respondents said they would go to a privacy commissioner, compared with 7% in 2004 and 5% in 2001. The following differences were observed:
NSW Respondents (14%) were more likely than those from other states to go to a privacy commissioner. Queenslanders and Tasmanians were the most likely to go to the police (37% and 39% respectively) and Tasmanians (33%) were also more likely to go to an ombudsman.
Those living in metropolitan areas (13%) were more likely to go to a privacy commissioner than those living elsewhere (7%).
Australians aged between 18-24 (38%) were more likely than those aged over 50 years (28%) to report a misuse to the police, while those aged over 35 years were more likely than younger Australians to say they would go to an ombudsman.
Those with tertiary level qualifications are more likely to go to a privacy commissioner (18%) or an ombudsman (24%) while those who have up to a Year 12 equivalent education (35%) are more likely to go to the police.
Chart 3. Reporting misuse of personal information
Q. If you wanted to report the misuse of your personal information, who would you be most likely to contact?
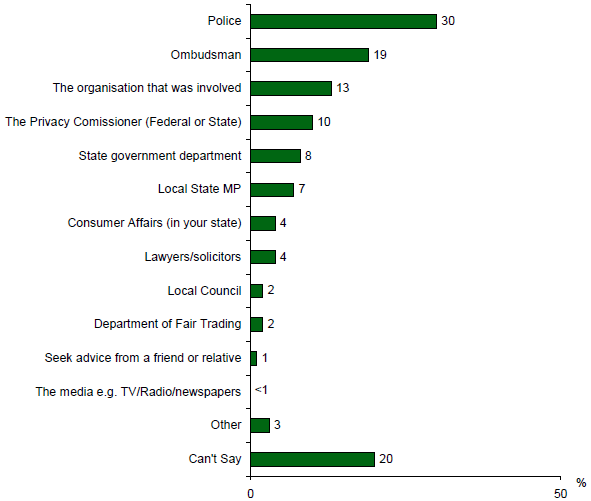
Base: All respondents (n=1503)
5.4 Knowledge of which organisations are covered by the Privacy Act
The Privacy Act 1988 applies to:
- Australian and ACT Government departments;
- businesses with a turnover of more than $3M; and
- small businesses that are health service providers, trade in personal information, are related to a business that is not a small business or are contractors providing services under a Commonwealth contract.
State Government departments are not covered by the Privacy Act, neither are most small businesses or businesses based overseas. Awareness of which organisations are generally covered by the Federal Privacy Act is covered in this section[2].
Respondents were read a list of organisations and asked which ones they believe are covered by the Privacy Act.
Chart 4. Knowledge of which organisations are covered by the Privacy Act
Q. I’m going to list six types of organisations. Which of these, if any, do you think GENERALLY must operate under the Federal Privacy Act?
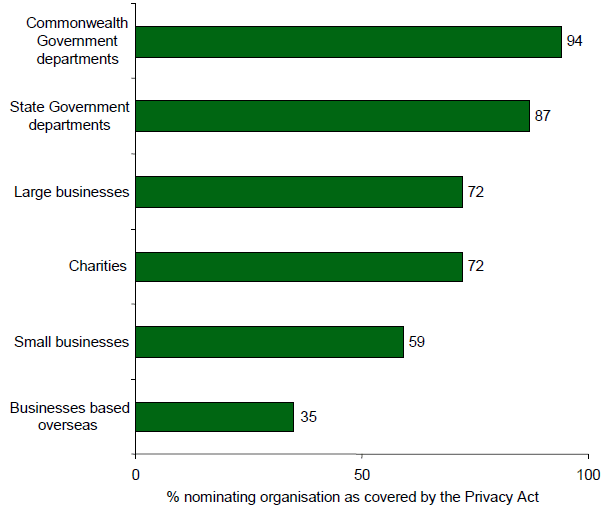
Base: All respondents (n=1503)
The vast majority of respondents correctly nominated Commonwealth Government departments (94%) as well as large businesses and charities (72%). Most (87%) perceive State Government departments and small business (59%) to be covered by the Privacy Act. Most were correctly aware that businesses based overseas are not covered, however 35% incorrectly thought them to be.
Australians aged up to 24 years were more likely to believe that the Privacy Act applies to all organisations. With the exception of businesses based overseas, those aged over 50 years were less likely to think organisations were covered.
Lower blue collar workers were more likely to believe that the Privacy Act is more comprehensive in its coverage than other respondents. Of these, 94% nominated State governments and 52% thought that businesses based overseas were covered. They were also more likely to nominate large business (81%) than were other respondents.
5.5 Knowledge of activities contravening the Privacy Act
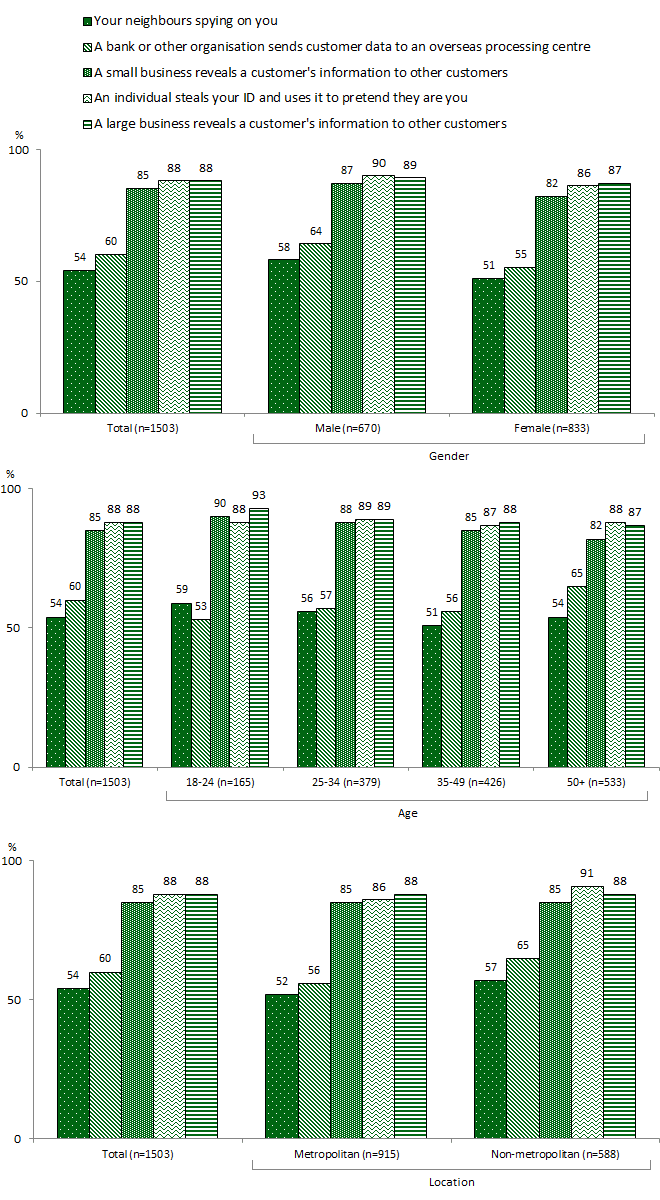
The Privacy Act covers the collection, storage, access and transfer of personally identified information on private individuals. Respondents were asked whether or not certain activities undertaken by different types of people or organisations were against the Privacy Act. The majority (88%) correctly, were of the opinion that ID theft and revealing customer information — by large (88%) or small (85%) business — contravenes the Privacy Act. Spying by neighbours was incorrectly thought to be a contravention by 54% and 60% thought that a bank sending customer information overseas was a violation of the Act.
Chart 5 shows that women were more likely than men to think that all these activities contravened the Act. In addition:
Those aged over 50 years (65%) were more likely than those under 50 (18-24 – 53%, 25-34 – 57% and 35-49 – 56%) to believe that a bank sending customer information overseas contravenes the Act.
Those with a tertiary education were less likely than average to believe that spying(44%) or sending information overseas (48%) contravene the Act.
Chart 5. Activities respondents feel contravene the Privacy Act — By sex, age and location
Q. Which of the following activities, if any, would be against the Federal Privacy Act?
Base: All respondents (n=1503)
6.0 Trust in organisations
As in previous surveys, respondents were asked to rate the trustworthiness of certain organisations[3] in regard to the protection of their personal information. Including:
- Financial institutions;
- Real estate agents;
- Charities;
- Government departments;
- Health service providers including doctors, hospitals and pharmacists;
- Market research organisations;
- Businesses selling over the Internet;
- Retailers; and
- Insurance companies (included for the first time in the 2007 survey).
6.1 Levels of trust in types of organisation handling personal information
Perceived trustworthiness, in regard to the protection of personal information, has increased for Health Service Providers and Government departments in comparison with 2004. It was stable for charities, market research organisations and real estate agents and it declined for financial institutions.
Health Service Providers are trusted most (91%), with lower levels of trust associated with Government departments (73%), financial institutions (58%) and charities (53%). Other organisations elicited higher levels of mistrust than trust.
Chart 6. Trust in organisations handling personal information
Q. How trustworthy or untrustworthy would you say the following organisations are with regards to how they protect or use your personal information?
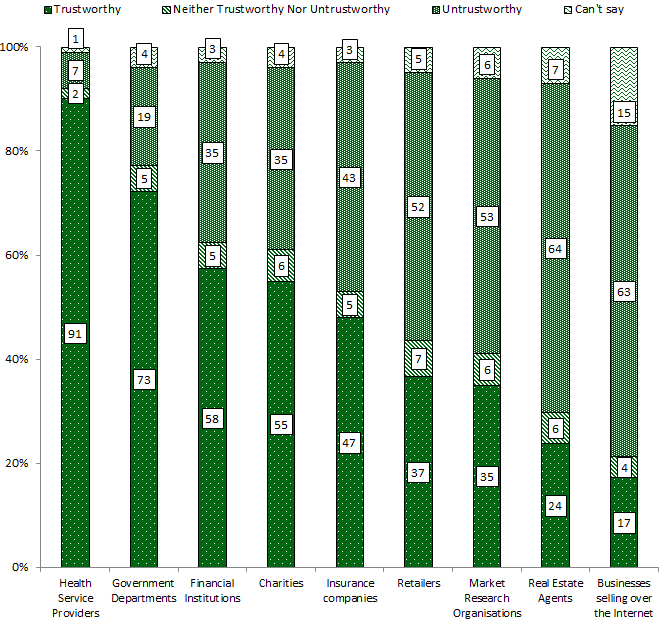
Base: All customers (n=1503)
6.1.1 Health Service Providers
There has been a steady increase in the proportion of respondents who say they trust Health Service Providers during the survey periods (91% in 2007, 89% in 2004, 84% in 2001 and 70% in 1994). Health Service Providers are believed to be trustworthy by 91% of Australians. Australians who hold tertiary qualifications (88%) are less likely to feel that Health Service Providers are trustworthy than those educated up to Year 12 (92%).
6.1.2 Government departments
There has been a significant, positive shift in attitudes towards government departments since 2001. Government departments are believed to be trustworthy by 73% of Australians, compared with 64% in 2004 and 58% in 2001. Government departments are now perceived to be more trustworthy than financial institutions. As age increases the degree of trust in government departments decreases, with 87% of 18 – 24 year olds finding them trustworthy, compared with 67% of Australians aged over 50.
6.1.3 Financial institutions
Levels of trust in financial institutions declined from 66% in 2004 to 58% in 2007. The current level of trust is at similar levels to those measured in 2001 (59%). Regardless of the decline, financial institutions remain among the most trusted types of organisations. 18-24 year olds (73%) are more likely than those aged over 50 years (50%) to say that financial institutions are trustworthy. Retirees (48%) are less likely to trust financial institutions than those who are working (60%).
6.1.4 Charities
The level of trust in charities remains stable at 55%. However 69% of Australians aged 18-24 were the most likely to trust them, compared with 47% of Australians aged over 50. Tasmanians (67%) were also more likely to trust charities in handling personal details compared with Australians living elsewhere.
6.1.5 Insurance companies
Whereas 47% of Australians thought insurance companies could be trusted with personal information, trust decreases with increasing age, with 55% of 18-24 year olds finding them trustworthy compared with 41% of Australians aged over 50.
6.1.6 Retailers
Trust in retailers’ handling of personal information has remained stable over the course of the surveys. In 2007, 37% thought retailers were trustworthy, compared with 39% in 2004 and 36% in 2001. Trust in retailers is greater amongst people living in non-metropolitan areas (42%). Education is also a factor, with a lower proportion of those holding a tertiary qualification (31%) trusting retailers, compared with those educated up to Year 12 (42%).
6.1.7 Market research organisations
There was no difference in perceived levels of trustworthiness of market research organisations between 2004 and 2007 (35%). Levels of trust remain higher than they were in 2001 (32%) and 1994 (29%). Western Australians (42%) and Tasmanians (46%) were more likely than those from NSW (32%) and Victoria (32%) to think market research organisations are trustworthy. Queenslanders (37%) and South Australians (36%) were close to the national average (35%).
6.1.8 Real estate agents
There continues to be a low level of trust within the community in real estate agents’ handling of personal information, with only 24% saying they are trustworthy. Although this is the same as 2004 (26%), it remains higher than 2001 results (20%).
6.1.9 Businesses selling over the Internet
Businesses selling over the Internet continue to be perceived as the least trustworthy of the organisations considered by respondents. While only 17% considers these to be trustworthy, it is a significant improvement on 2004 (9%).
7.0 Interactions with organisations
The exchange of personal information between individuals and organisations occurs when interactions take place, whether initiated by the individual or the organisation. This section examines some of the issues around these interactions. Topics examined are:
- types of information that people are reluctant to provide;
- omitting information from forms;
- decisions about dealing with organisations on the basis of their handling personal information;
- attitudes towards unsolicited marketing material; and
- attitudes towards providing personal information in exchange for benefits.
7.1 Types of information respondents are reluctant to provide
Respondents were asked which types of information they are, in general, reluctant to provide. As was the case in 2001 and 2004 they were most reluctant to provide financial details and details about income, followed by contact details. However, there was a decline in the proportion that were reluctant to provide financial details (43% in 2007 versus 58% in 2004).
Compared with 2001 and 2004, Australians were far less likely to say that they are reluctant to provide their medical history/health information. This large shift, from 21% in 2004 to 6% now may be related to the increasing level of trust Australians have in health service providers’ ability to manage their personal information (see section 6.1.1). To a lesser extent, there was also a decline in reluctance to provide email addresses, genetic information or a name.
Table 3. Types of information Australians are reluctant to provide
Q. When providing your personal information to any organisation, In general, what types of information do you feel reluctant to provide?
| Type of information | 2001 (n=1524) % | 2004 (n=1507) % | 2007 (n=1503) % |
|---|---|---|---|
| Financial details | 59 | 58 | 43 |
| Details about income | 42 | 34 | 34 |
| Home phone number | 17 | 22 | 25 |
| Home address | 14 | 20 | 19 |
| Email address | 11 | 19 | 14 |
| Date of birth | 7 | 8 | 10 |
| Marital status | 9 | 9 | 7 |
| Medical history/health information | 25 | 21 | 6 |
| Genetic information | 13 | 11 | 5 |
| Name | 6 | 7 | 4 |
| How many people or males in the household/ family member details | 1 | 2 | 4 |
| Religion | 2 | 3 | 2 |
| Drivers licence | - | - | 1 |
| Occupation | - | - | 1 |
| Other | - | - | 4 |
| Depends | - | - | 2 |
| None | 16 | 11 | 10 |
Base: all respondents
Bold denotes a significant move up, italics a significant shift down between 2007 and 2004
Note: answers add up to more than 100 as multiple responses were given
Respondents were asked which one type of information they are most reluctant to provide. Their answers are shown in Table 4.
Table 4. Type of information MOST reluctant to provide
Q. And of [LIST ANSWERS PROVIDED] which one of these do you feel most reluctant to provide?
| Type of information | 2001 (n=1524) % | 2004 (n=1507) % | 2007 (n=1503) % |
|---|---|---|---|
| Financial details | 40 | 41 | 35 |
| Details about income | 11 | 10 | 18 |
| Home phone number | 3 | 5 | 9 |
| Home address | 4 | 7 | 7 |
| Email address | 2 | 5 | 5 |
| Date of birth | 1 | 1 | 3 |
| Medical history/health information | 7 | 5 | 2 |
| How many people or males in the household/ family member details | <1 | <1 | 2 |
| Genetic information | 3 | 2 | <1 |
Base: all respondents
Bold denotes a significant move up, italics a significant shift down between 2007 and 2004
Financial details were still nominated by 35% of respondents, a lower proportion than in 2004. However, 18% nominated details about income – an 8% increase from 2004.
Differences in opinion were observed between:
People living in households earning more than $100,000 (19%) are the most likely to be reluctant to provide details about their income (cf. 11% of those living in households earning less than $25,000). However, these groups share a similar level of concern about providing their financial details (less than $25,000 – 34%, and greater than $100,000 – 31%).
Those living in metropolitan areas (31%) are less concerned about providing their financial details than those living elsewhere (40%).
As was the case in 2004, Australians’ concerns about providing financial details increased with increasing age. Conversely, younger Australians are the most concerned about releasing their home phone number or home address.
7.2 Reasons why people are reluctant to provide information
For most, the principal reason for not wanting to provide personal details is that it is none of their business (36%). Following this are the potential for financial loss (14%), becoming the victim of crime (12%), or being subjected to marketing activity (via telephone or in person) (12%).
Table 5. Reasons for being reluctant to provide information
Q. And what is your MAIN reason for not wanting to provide your [ANSWER PREVIOUS QUESTION]
| Reasons for being reluctant to provide information | 2001 (n=1306) % | 2004 (n=1294) % | 2007 (n=1305) % |
|---|---|---|---|
| It’s None of Their Business / Invasion of Privacy | 51 | 44 | 36 |
| May Lead to Financial Loss / People Might Access Bank Account | 7 | 8 | 14 |
| For Safety / Security / Protection (From Crime) | 2 | 6 | 12 |
| I Don’t Want to Be Bothered/ Hassled / Hounded (by Phone / Door to Door) | 1 | 5 | 12 |
| The Information May Be Misused | 12 | 8 | 11 |
| Don’t Want Junk Mail / Unsolicited Mail / Spam | 1 | 5 | 11 |
| Unnecessary / Irrelevant to Their Business or Cause | 2 | 5 | 9 |
| I Do Not Want People Knowing Where I Live/ How to Contact Me | 6 | 5 | 5 |
| Information Might Be Passed on Without my Knowledge | 5 | 3 | 5 |
| Discrimination | 4 | 3 | 2 |
| I Do Not Want to Be Identified | 3 | 1 | 2 |
| Other | 3 | 3 | 2 |
| Can’t Say | 4 | 2 | 1 |
Base: reluctant to provide information
Bold denotes a significant move up, italics a significant shift down between 2007 and 2004
7.3 Omitting information from forms
A measure of sensitivity to privacy concerns is how often people omit details from forms. Information has been left off forms by 80% of Australians – and the proportion is increasing. Further, 28% always or often engage in this behaviour – up from 24% in 2004 and 22% in 2001.
Chart 7. Frequency with which information is omitted from forms
Q. When completing forms or applications that ask for personal details, such as your name, contact details, income, marital status etc, how often, if ever, would you say you leave some questions blank as a means of protecting your personal information?
Base: All respondents (n=1503)
Those more likely to leave information off forms:
- live in metropolitan areas (82% cf. 78% of those living elsewhere)
- have a tertiary qualification (84% cf. 76% of those with Year 12 equivalent or less).
- live in Victoria (85%)
Retirees or those living in households earning less than $25,000 (70% and 75% respectively) were the least likely to leave information off forms.
7.4 Avoided dealing with an organisation to protect personal information
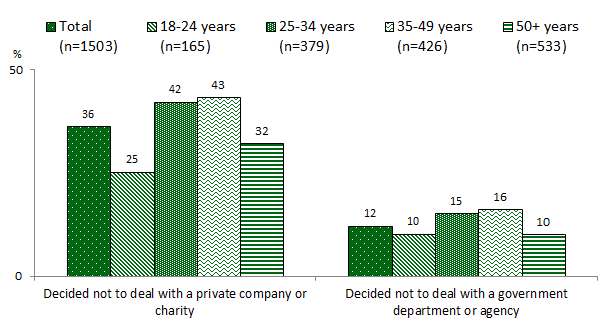
Another measure of how concerned people are about privacy is whether or not they have decided against dealing with an organisation because of privacy concerns. The proportion who said they had decided not to deal with an organisation due to concerns about the handling of their personal information has not shown a great deal of fluctuation since 2001. As with previous surveys, respondents are more likely to have decided not to deal with a business or charity (36%) than a Government department (12%).
Chart 8. Decided NOT to deal with an organisation to protect personal information
Q. Firstly, have you ever decided not to deal with a private company or charity because of concerns over the protection or use of your personal information?
Q. Have you ever decided not to deal with a government department because of concerns over the protection or use of your personal information?
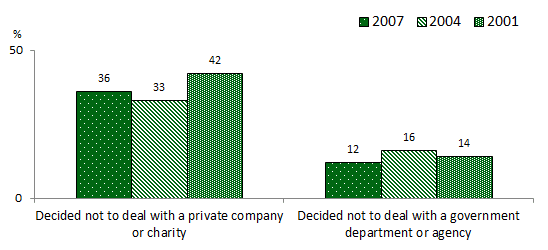
Base: All respondents (n=1503)
The proportion who avoided dealing with a business or charity (36%) was higher than in 2004 (33%), but still lower than that recorded in 2001 (42%). The proportion who had decided not to deal with a government department or agency at 12% was the lowest recorded to date. The proportion was 16% in 2004 and 14% in 2001.
Those more likely not to have dealt with a business or charity included:
- Those living in metropolitan areas (43% cf. 39% elsewhere)
- Those with tertiary qualifications (43% cf. 39% Year 12)
- Upper white and upper blue collar workers (40%)
Overall, 14% of Australians had decided not to deal with Government departments. The only groups to vary significantly from the national average were those not working (19%) and retirees (8%).
As shown in Chart 9, middle aged Australians are more likely than other Australians to say they have not dealt with either type of organisation due to concerns about their personal information.
Chart 9. Decided NOT to deal with an organisation by age
Q. Firstly, have you ever decided not to deal with a private company or charity because of concerns over the protection or use of your personal information?
Q. Have you ever decided not to deal with a government department because of concerns over the protection or use of your personal information?
Base: All respondents (n=1503)
7.5 Attitudes towards unsolicited marketing material
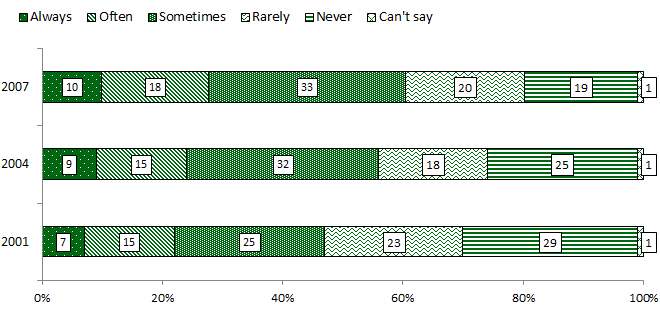
Respondents were read five statements as shown in Chart 10 and asked to choose the one that describes how they feel when they receive unsolicited marketing material the best. Some respondents chose more than one option, as was the case when this question was asked in previous studies, therefore responses in Chart 10 add to more than 100.
Chart 10. Reactions to unsolicited marketing material
Q. Which of the following statements best describes how you generally feel when organisations that you have never dealt with before send you unsolicited marketing information?
Base: All respondents (n=1503)
The community’s reactions are gradually becoming less favourable. Australians’ main reaction is to be concerned about how direct marketing organisations obtain their details (53%). This was up from 2004 (43%), yet similar to 2001 (55%). There was an increase in the proportion feeling angry and annoyed when they receive unsolicited marketing material, up from 21% in 2004 to 27%.
Overall, the proportion showing annoyance or concern has remained stable at 80%. The proportion of Australians who were not bothered by such material has halved from 23% to 11%. The same shift has been seen over a longer time frame amongst those who enjoy receiving the material – only 4% currently enjoys it compared with 9% in 2001.
Age and employment status were the main discriminating factors underpinning attitudes:
Those aged 35-49 years (61%) were more likely than those aged 18-24 years (44%) to be concerned about where organisations had obtained their personal information.
Those aged 18-24 (17%) were more likely than the national average to say they don’t care and are not bothered by unsolicited marketing material.
Employers or the self-employed (35%) are the most likely group to be angry and annoyed when they receive unsolicited marketing material.
7.6 Attitudes towards providing personal information for benefits
This section covers community attitudes towards providing personal information if they were offered a discount or the chance to win a prize.
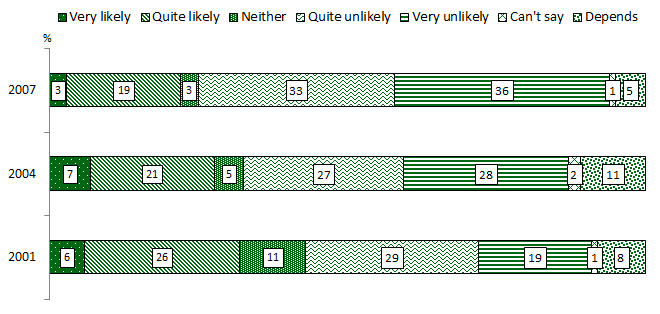
As shown in Chart 11, there is clearly a declining trend in willingness to provide personal details in exchange for a discount. Furthermore, the proportion unsure of whether or not they would provide information has decreased since 2004.
Chart 11. Likelihood of providing personal information for discount
Q. Generally, how likely or unlikely would you be to provide your personal information to an organisation if it meant you would receive discounted purchases?
Base: All respondents (n=1503)
Twenty two percent (22%) would be likely to provide personal information to an organisation for discounted purchases. This compares to 28% in 2004.
The profile of those likely to provide personal information in exchange for a discount remains the same as in past measures – it decreases with increasing age. However, even those most likely, the 18-24 year age group, are significantly less likely to do this now (39% compared with 54% in 2004).
The likelihood of providing personal information in exchange for a prize, at 14% of the population, is much lower than would give it for a discount (22%).
Younger age groups were again the most likely to say they would provide personal information to win a prize, (18-24 years – 18%, and 25-34 years – 22%). Only 10% of respondents over 50 years old would be likely to provide information if a prize was offered.
Chart 12. Proportion likely to provide personal information for discount or prize
Q. Generally, how likely or unlikely would you be to provide your personal information to an organisation if it meant you would receive discounted purchases?
Q. And how about if it meant you would have a chance to win a prize?
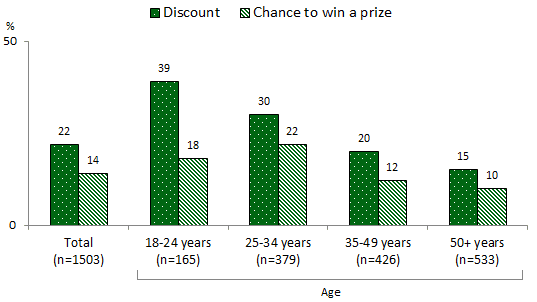
Base: All respondents (n=1503)
8.0 Businesses and privacy
Business practices and community attitudes towards them are an important topic in privacy because businesses handle large volumes of personal information. Topics covered in this section are the:
- use of public lists, such as the Electoral Roll and the White Pages telephone directory, for marketing purposes;
- degree to which the community regard certain scenarios as misuses of information; and
- levels of concern in the community regarding businesses sending personal information overseas for processing.
8.1 Use of the Electoral Roll and White Pages for marketing purposes
Australians were polarised as to whether businesses should be able to use the White Pages for marketing purposes. A slim majority disagrees (50%) and just under half (46%) agrees with this proposition – significantly more than agreed to use of the Electoral Roll as Chart 13 shows. Australians are increasingly against the practice of using the Electoral Roll for marketing purposes, with 82% saying they disagree with this practice, compared with 77% in 2004 and 70% in 2001.
Chart 13. Use of the Electoral Roll and White Pages for marketing purposes
Q. I would like you now to think about your privacy and businesses. I’m going to read you a number of statements and I’d like you to tell me whether you agree or disagree with each:
- businesses should be able to use the electoral roll for marketing purposes
- businesses should be able to collect your information from the White Pages telephone directory without your knowledge for the purposes of marketing
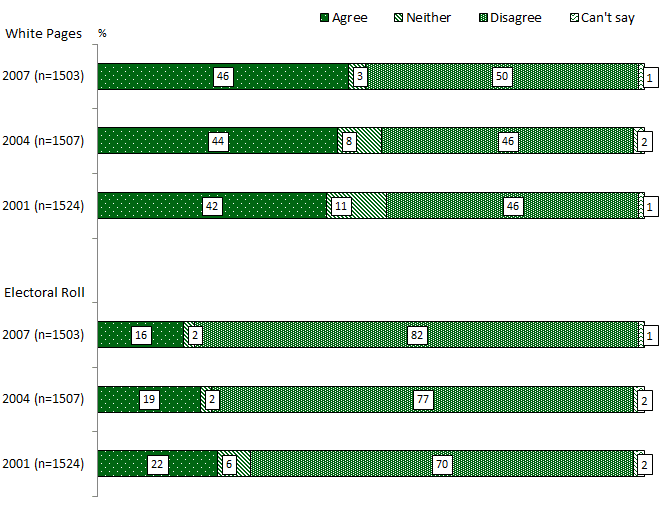
Base: All respondents (n=1503)
8.2 Misuses of personal information by businesses
Respondents were read four scenarios as shown in Chart 14 and asked whether or not they felt each was a misuse of personal information. The vast majority regarded all the scenarios as misuses of personal information, although they were slightly more likely to say that monitoring activity on the Internet (96%) was a misuse of information than the other scenarios (93-94%).
Younger Australians aged between 18 and 24 (99%) were unanimous in agreeing that businesses that use personal information for something other than was originally agreed was a misuse of personal information. They were also less likely than the national average to say that a business they do not know getting hold of their personal information is a misuse of that information, with 90% agreeing compared with 93% of Australians.
Chart 14. Scenarios regarded as misuses of personal information by businesses
Q. Which of the following instances would you regard to be a misuse of your personal information?
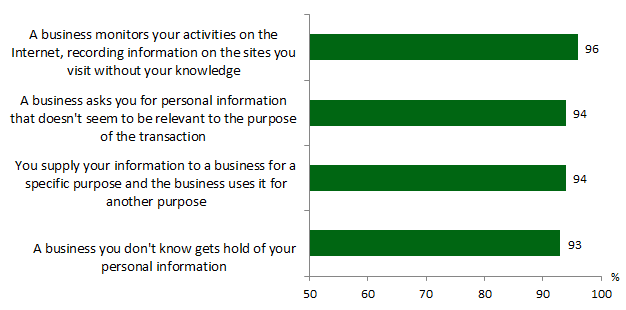
Base: All respondents (n=1503)
8.3 Levels of concern about business sending personal information overseas for processing
The majority of Australians (90%) are concerned about their personal information being sent overseas, with 63% being very concerned. The level of concern varies amongst different groups. Those showing the highest level of concern being:
- Middle-aged Australians (35-49), with 70% saying they were very concerned. The proportion is similar (73%) for Australians aged over 50.
- People living in households earning under $75,000. Amongst these Australians, 66% are very concerned, compared with 54% of people living in households earning higher incomes.
- Females - with 67% being very concerned, compared with 59% of males.
Chart 15. Concern about business sending personal information overseas
Q. How concerned are you about Australian businesses sending their customers’ personal information overseas to be processed?
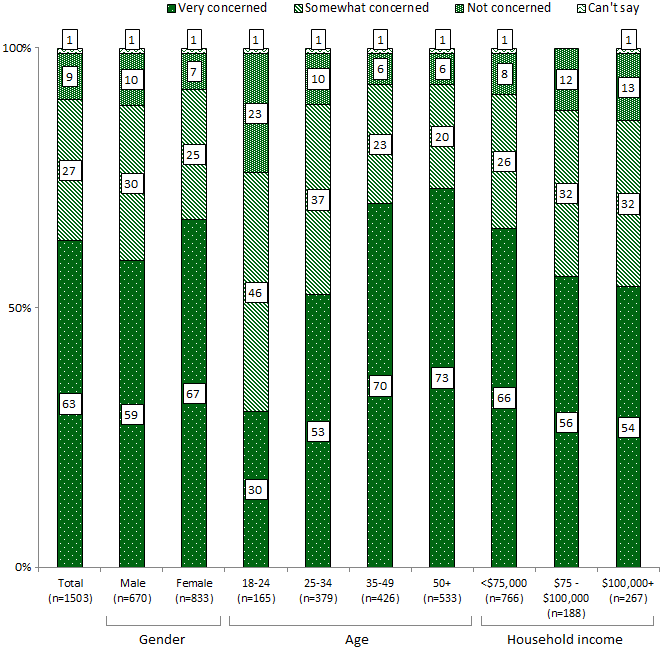
Base: All respondents (n=1503)
Although not shown in the Chart, people working in lower blue collar occupations (76%) and people living in non-metropolitan areas (69%) also showed significantly higher concern levels.
9.0 Government departments and privacy
There are many benefits of technology that could be utilised by Government departments and agencies to improve the efficiency and quality of the services they provide. In particular the ability to share information electronically means that once a client of one department updates their details, all departments they deal with could access the updated information and update their records automatically. This sections deals with community attitudes to facilitating and maintaining such services.
Specifically addressed are attitudes towards:
- a unique identifier for clients of all Australian Government departments;
- whether it is appropriate for Government departments to share information;
- the purposes for which Government departments should be able to share information; and
- what scenarios constitute misuses of personal information by Government departments.
9.1 Attitudes towards a unique identifier for all Australian government departments
A unique identifier would allow Government departments to identify when they are dealing with the same person as another government department and allow better tracking of Government clients resulting in improved services and efficiency.
Support for a unique identifier has increased from 53% in 2004 to 62% in 2007. This increase is driven by those who strongly agree with the proposal (33% compared to 25% in 2004). The proportion who partly agree remains stable (29% cf. 28% in 2004).
Chart 16. Attitudes towards a unique identifier for all Australian Government departments
Q. If it was suggested that you be given a unique number to be used for identification by all Commonwealth Government departments and to use all Government services, would you be in favour of this?
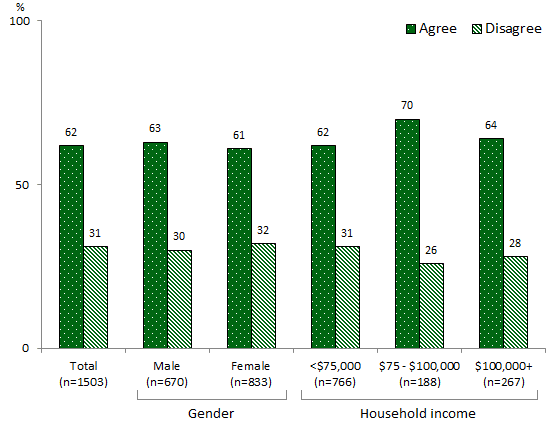
Base: All respondents (n=1503)
As shown in Chart 16, the highest level of support overall came from respondents who live in households earning between $75,000 and $100,000 per annum (70%). Other respondents displaying above average support were those who:
- Live in non-metropolitan areas (65%)
- Live in South Australia (67%).
Support was lower amongst those aged 18-24 years (54%) and Western Australians (52%).
9.1.1 Sharing of personal information between Government departments
The proportion of those who believe that Government departments should be able to cross- reference or share information about Australians remains significantly greater than those who do not think information should be shared. Further, the proportion in favour of sharing information has increased to 80% from 71% in 2004. Now 19% believes that information should be shared for any purpose (cf. 10% in 2004), with 65% continuing to say that information should be shared but only for some purposes.
Chart 17. Circumstances under which Government departments should be able to share information
Q. Do you believe Government departments should be able to cross-reference or share information in their databases about you and other Australians for any purpose, some purposes or not at all?
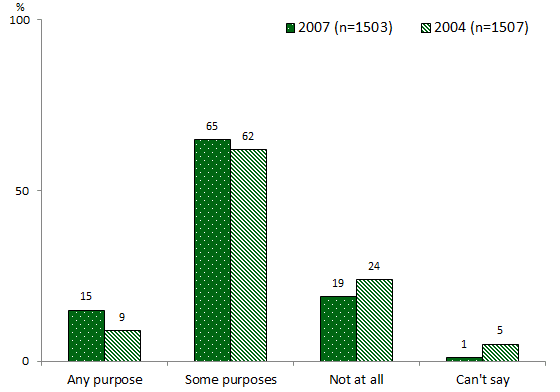
Base: All respondents (n=1503)
The results in 2007 echo those from 2004 with attitudes varying depending on gender, age and income. In particular:
- Males (17%) were more likely than females (13%) to say that Government departments should share information for any purpose.
- Agreement that information should be shared for any purpose increased with age and household income.
Respondents who were in favour of information being shared were asked to identify the circumstances in which this would be appropriate. Chart 18 shows that 77% believe it appropriate in the case of crime prevention and 67% support it for updating contact details.
Support for sharing information on the grounds of reducing costs or increasing efficiency is lower at 49%. Of those who said that Government departments should be able to share information, 20% did not agree to any of the purposes read out to them.
Chart 18. Purposes for which Government departments should be able to share information
Q. For which of the following purposes do you believe Governments should be allowed to cross reference your personal information?
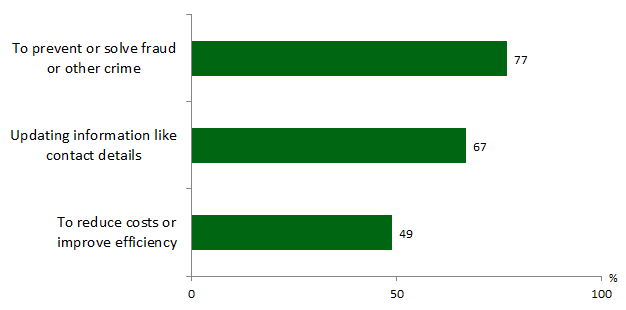
Base: Believe government should be able to share information (n=1210)
9.2 Scenarios regarded as misuses of personal information by government departments
Respondents were read four scenarios and asked to identify which ones they considered to be a misuse of their personal information. The majority thought that asking for irrelevant information, using information for a purpose other than that for which it was provided and monitoring activities on the Internet were equally misuses of their personal information (as shown in Chart 19). However, while 73% still believe that a government department they had not dealt with getting hold of their personal information constituted a misuse of that information, they were considerably less likely to regard this as a misuse compared with the other three scenarios.
Although the vast majority still regard most of these scenarios as misuses of their personal information, they are slightly less likely to think so than when the same scenarios are applied to businesses. In other words, Australians are more tolerant of government than of private businesses.
Chart 19. Scenarios regarded to be misuses of personal information
Q. Which of the following instances would you regard to be a misuse of your personal information?
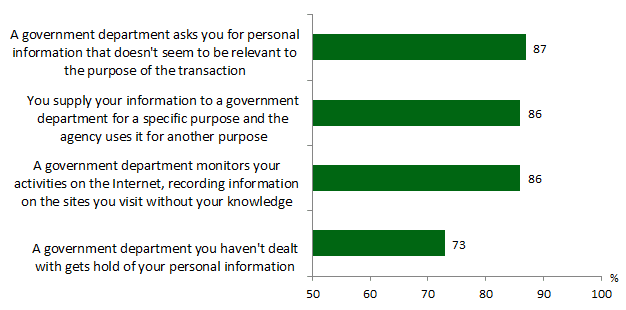
Base: All respondents (n=1503)
These views were held consistently across the Australian public with the following exceptions:
Females were more likely than males to believe the stated scenarios were misuses of information, with the exception of monitoring activities on the Internet, where both males and females were equally likely to feel it is a misuse of information.
Those with an education up to Year 12 equivalent (80%) were more likely to believe that a Government department they had not dealt with getting hold of their personal information is a misuse of personal information.
Tasmanians (97%) were the most likely to believe that using information for a purpose other than that for which it was provided was a misuse of personal information.
10.0 Health services and privacy
This section examines community attitudes to privacy in the health system. Topics covered are attitudes towards:
- the inclusion of health information in a national health database, both generally and specifically in a de-identified form for research purposes;
- health professionals discussing and sharing patient information; and
- the disclosure of genetic information if a patient has an illness which a relative may also have.
10.1 Attitudes towards inclusion in a national health database
A national health database would assist in improving the efficiency and quality of services provided by the healthcare system. Identifiable information could be used to access patients’ medical histories if urgent treatment was required, as well as make it easier to transfer medical records between treating health professionals. De-identified information could be used by researchers to plan health services more accurately. Respondents were read the following introduction and then asked whether or not they thought inclusion in the database should be voluntary:
The idea of building a National Health Information Network has been put forward. If this existed it would be an Australia-wide database which would allow medical professionals anywhere in Australia to access a patient’s medical information if it was needed to treat a patient. The information could also be used on a de-identified basis to compile statistics on the types of treatments being used, types of illnesses suffered and so on…
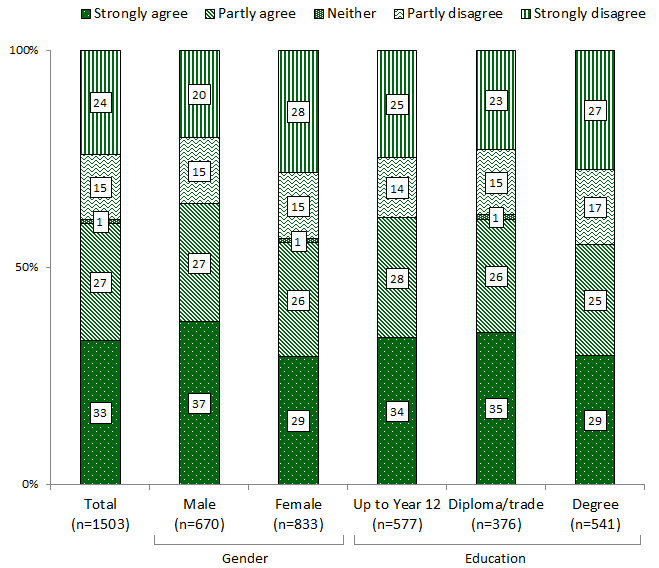
The majority (76%) of Australians believe that inclusion in the National Health Information Network should be voluntary. At 21%, the minority believes all medical records should be entered. A greater proportion (76%) believe inclusion should be voluntary (cf. 64% in 2004 and 66% in 2001). As in 2004, females (80%) were more likely than males (72%) to say this. Unlike 2004 however, there were no significant differences in attitudes between age groups.
Chart 20. Inclusion of medical information in a National Health Information Network
Q. If such a database existed, do you think inclusion of your medical information should be VOLUNTARY, or should ALL MEDICAL RECORDS be entered without permission or consent?
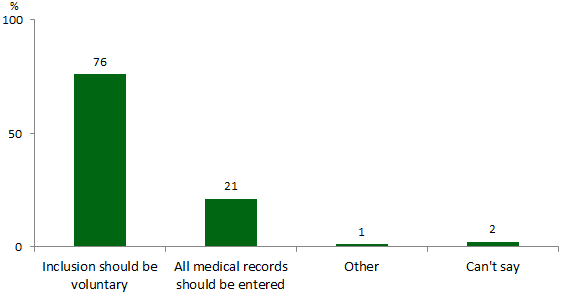
Base: All respondents (n=1503)
Respondents were then asked whether, if such a database existed, permission should be sought before releasing their de-identified information. Females (53%) were more likely than males (43%) to say that permission should be sought.
Chart 21. Permission sought before de-identified health information released
Q. Health information is often sought for research purposes and is generally de-identified, that is, NOT linked with information that identifies an individual. Do you believe that an individual’s permission should be sought before their de-identified health information is released for research purposes or not?
Base: All respondents (n=1503)
10.2 Attitudes towards health professionals sharing patient information
While opinions varied, 44% thought that health professionals should share health information, but only if relevant to the condition being treated (32%) or if the condition was serious or life threatening (12%). Thirty percent (30%) believed health professionals should share health information only with the patient’s consent. The proportion believing anything to do with a patient’s health care could be discussed between health professionals stands at 26%.
Attitudes to this proposition varied from state to state. Victorians (40%) were the most likely to believe that information should only be shared for the purpose of treating a specific condition. Western Australians (19%) were more likely than Victorians (10%) or those from NSW (11%) to say that information should only be shared if the condition is serious or life threatening.
Retirees (34%) were the most likely to support the sharing of information for anything to do with my health care.
Chart 22. Attitudes towards health professionals sharing information
Q. When do you think your doctor should be able to share your health information with other doctors or health service providers?
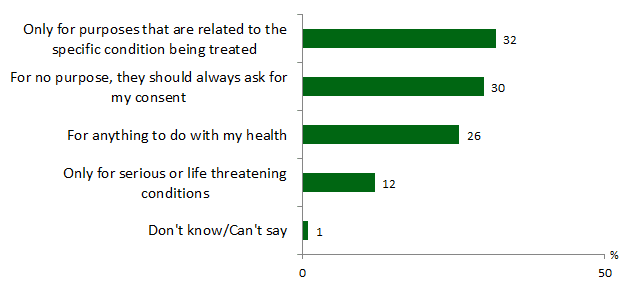
Base: Respondents giving a single answer (n=1378)
Some respondents provided multiple responses to this question. For analysis purposes, only the answers of respondents who gave a single response are shown.
10.3 Attitudes towards doctors discussing personal medical information in an identifiable way
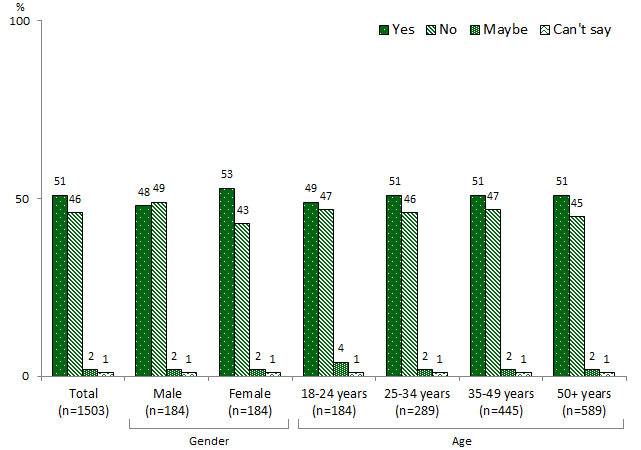
Respondents were asked whether they thought their doctor should be able to discuss their personal medical details with other health professionals in a way that identifies them without their consent. This was believed to be acceptable by 60% – the same proportion as in 2004 (60%) and a marked increase from 2001 (53%). Males (64%) were more likely than females (55%) to agree with this proposition. On the other hand those with a tertiary level education (54%) were less likely to agree than those educated up to Year 12 equivalent (63%) or with a diploma or trade qualification (61%).
Chart 23. Attitudes to doctors discussing patient details with other medical practitioners
Q. Do you agree or disagree that your doctor should be able to discuss your personal medical details with other health professionals – in a way that identifies you – without your consent if they believe this would assist your treatment?
Base: All respondents (n=1503)
10.4 Attitudes to the disclosure of the fact that a patient has a genetic illness — with and without consent
Respondents were asked whether a relative of a patient with a genetic illness should be informed, and if so under which of the following circumstances:
- With the consent of the patient;
- Without consent if there is a strong possibility that the relative has the condition; or
- Without consent even if it is unlikely that the relative has the condition.
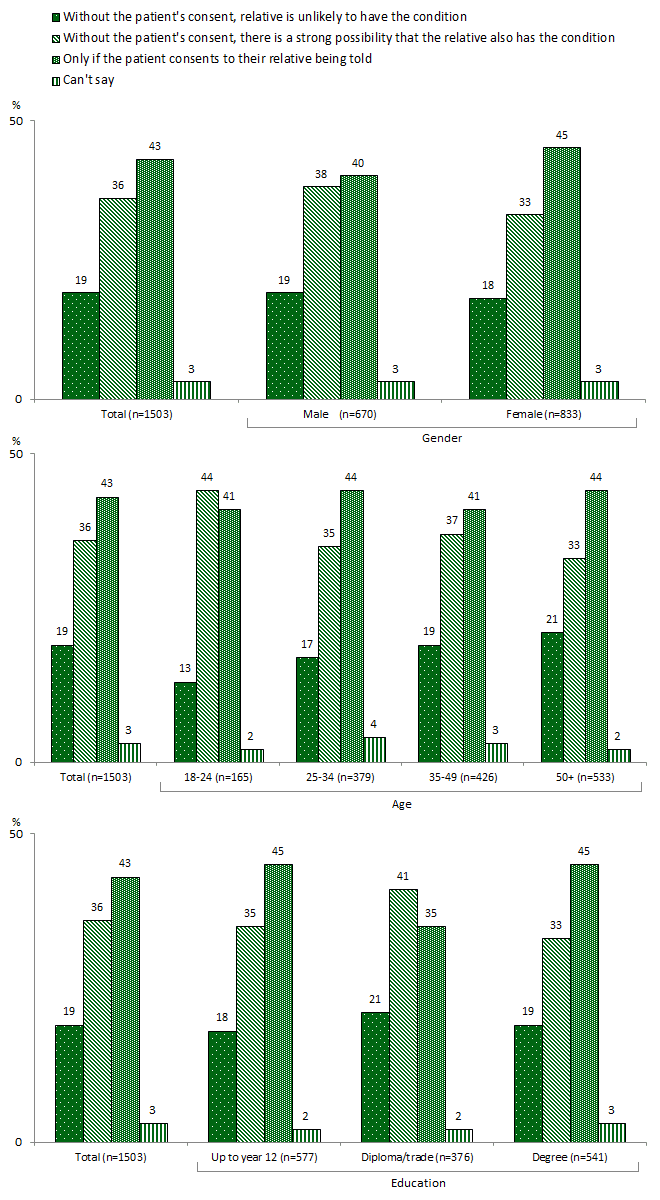
A slim majority (55%) believe that relatives should be told without the consent of the patient. This comprises 36% who believe that relatives should be told in the event that there is a strong possibility they may have the illness – especially Victorians (40%) and Australians aged under 24 (44%) – and 19% who are happy for the relative to be informed with no consent even if it is unlikely that the relative has the condition. Agreement with the latter statement increases with increasing age as Chart 24 demonstrates.
Forty three percent (43%) believe that relatives should be told only with the consent of the patient. Women are particularly likely to think this (45%).
Chart 24. Attitudes to the disclosure of the fact that a patient has a genetic illness — with and without consent
Q. If a person has a serious genetic illness, under what circumstances do you think it is appropriate for their doctor to tell a relative so the relative could be tested for the same illness?
Base: All respondents (n=1503)
11.0 Privacy in the workplace
As technology, such as computers, Global Positioning System (GPS) devices and recording equipment, become more prevalent in society, new privacy issues arise as employers can access more information about their employees. This section examines these issues as well as whether employees should have access to the information employers keep about them and the policies that govern how this information is kept.
11.1 Employees’ access to information employers keep about them
Respondents were asked whether they thought employees should have access to information employers keep about them. As was the case when asked in 2004, 86% thought they should. However, unlike in 2004, there were no significant differences in the responses of people of different age and gender. Instead, those most likely to believe employees should have access to the information employers hold about them were:
- tertiary level qualified (91%) – in particular compared to those with up to a Year 12 education (82%);
- living in households with incomes over $100, 000 (90%); and
- those working in upper white collar occupations (89%).
As only 33 (2%) of the 1,503 respondents classified themselves as employers, the attitudes expressed here are predominantly those of employees (65%), retirees (19%), students (4%) and others not in the workforce (10%).
Chart 25. Attitudes towards employees having access to information their employer keeps about them
Q. Do you think employees should have access to the information their employer holds about them?
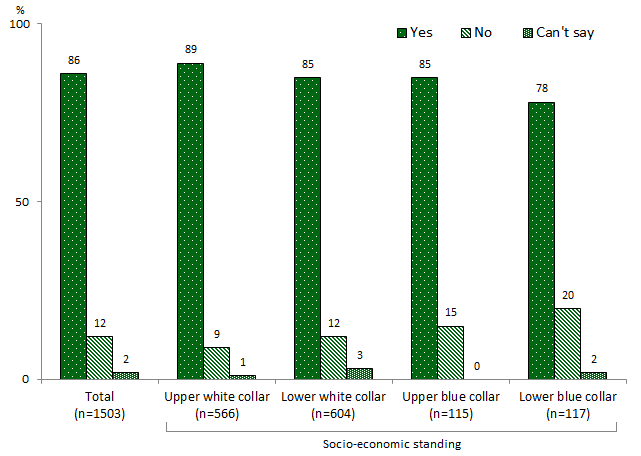
Base: All respondents (n=1503)
11.1.1 Employer activities and employee privacy
Respondents were asked to comment on whether and in what circumstances they believed it was reasonable for employers to:
- Read emails;
- Conduct drug and alcohol tests;
- Monitor vehicle locations where GPS is fitted;
- Monitor the workplace via surveillance equipment;
- Monitor the contents of employees’ company computers; and
- Monitor telephone conversations.
Table 6. Attitudes towards employer activities and privacy
Q. I’m going to read you three statements. For each could you tell me if you think it’s appropriate behaviour for an employer to do whenever they choose, only if they suspect wrong-doing or not at all.
| Employer Behaviour | Reading emails (n=1503) % | Drug & Alcohol Testing (n=1503) % | Monitoring Vehicle Locations (n=1503) % | Surveillance (n=1410)[*] % | Monitoring Everything on Computer (n=1423)[*] % | Monitoring Telephone Conversations (n=1355)[*] % |
|---|---|---|---|---|---|---|
| Whenever they choose | 25 | 33 | 30 | 16 | 21 | 7 |
| Only if they suspect wrongdoing | 43 | 44 | 43 | 17 | 32 | 25 |
| Not at all | 30 | 20 | 25 | 22 | 28 | 29 |
| For the safety and security of employees | 44 | 18 | ||||
| For training and quality control purposes | 38 |
[*] Note: Some respondents provided multiple responses to this question. For analysis purposes, only the answers of respondents who gave a single response are shown.
Australians are most likely to believe that employers should only read employees’ emails, record what they enter into their computer, conduct drug and alcohol testing or monitor a vehicle location if they suspect wrongdoing. They are also most likely to believe that an employee should only be recorded on video or audio for the safety and security of employees and that the monitoring of telephone conversations should only occur for training and quality control purposes. Between 20% and 30% believe that employers have no right to undertake these activities under any circumstance.
There are differences of opinion:
- Those working in white collar occupations are the most likely to believe that it is appropriate for employers to engage in these activities if they suspect wrongdoing.
- Those working in blue collar occupations and those living in non-metropolitan areas are more likely to believe that employers should be able to engage in such activities whenever they choose.
- Younger respondents, aged 18-34 years, are most likely to believe that employers should not engage in these activities at all.
11.2 Attitudes towards employers reading emails, drug and alcohol testing and monitoring vehicle locations
Respondents were asked to say whether they believed that employers were entitled to carry out three of the six activities, whenever they choose, only if they suspect wrongdoing or not at all.
Chart 26. Attitudes to employers reading emails, drug and alcohol testing and monitoring vehicle locations
Q. I’m going to read you three statements. For each could you tell me if you think it’s appropriate behaviour for an employer to do whenever they choose, only if they suspect wrong-doing or not at all.
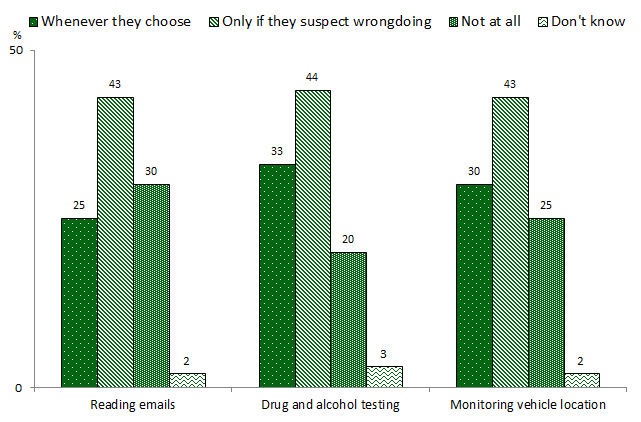
Base: All respondents (n=1503)
In comparison with the 2004 survey, more respondents (43% cf. 38%) said that employers should read employee emails only if they suspect wrongdoing and less said that this is never appropriate (30% in 2007 and 34% in 2004) – part time employees in particular, are likely to hold this opinion (36%).
The wording of the response categories relating to random drug and alcohol testing was slightly different in this survey. The one category that remained the same, whenever they choose saw a significant increase, from 23% in 2004 to 33% in the current survey, suggesting there is more support for this practice now than in 2004. Although 44% believes drug and alcohol testing should only happen if an employer suspects wrong doing, and 20% believes this should not happen at all – a significantly lower proportion than for the other two activities measured.
As GPS technology becomes more readily available, the question of whether it is appropriate to monitor employees’ vehicle locations gains significance. Respondents were asked their attitudes to the monitoring of employees’ work vehicles in the current survey. The most common response (43%) was that employers should only be able to do this if they suspected wrongdoing. The remainder was polarised between those believing employers could do this whenever they choose (30%) and those saying it should not be done at all (25%).
11.3 Attitudes towards employers using surveillance equipment to monitor the workplace
Forty four percent (44%) of respondents felt it was reasonable for employers to use surveillance equipment in the workplace for the safety and security of employees, 19% said employers should only be able to use such equipment if they suspected wrongdoing, and 22% that employers should not use it at all. Only 16% thought that employers should be free to record their employees whenever they choose. Amongst young people aged 18 – 24, 24% approved of this behaviour in employers – higher than other age groups.
Chart 27. Attitudes towards employers using surveillance equipment and monitoring everything employees type into their computer
Q. I’m going to read you three statements. For each could you tell me if you think it’s appropriate behaviour for an employer to do whenever they choose, only if they suspect wrong-doing, for the safety and security of all employees, or not at all? (Note, these statements were read to respondents at the same time as ‘monitoring employees’ telephone conversations’)
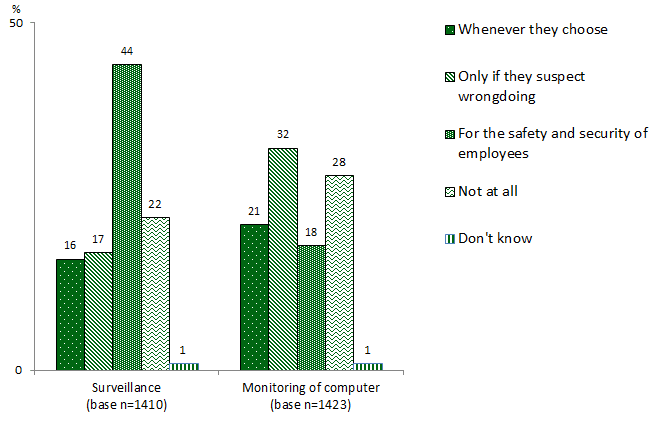
Base: Respondents giving single answer
Some respondents provided multiple responses to this question. For analysis purposes, only the answers of respondents who gave a single response are shown.
On the topic of when respondents think it appropriate for employers to monitor everything an employee types into their computer, views were more evenly spread - with 32% saying employers should only do this if they suspect wrongdoing and 28% thinking it unacceptable in any circumstances. The balance was divided between those who felt it was appropriate for safety and security only (18%), and those who had no misgivings about employers doing this whenever they choose (21%). In contrast to their attitudes on general surveillance, younger Australians were the least likely to think that employers should monitor the contents of computers whenever they choose (7%).
11.4 Attitudes towards employers monitoring telephone conversations
Respondents were finally asked when they think it is appropriate for employers to monitor telephone conversations. As many organisations monitor frontline and call centre staff as standard practice, respondents had an extra category to choose from when answering this question, namely for training and quality control purposes – which was the most commonly selected response at 38%. This practice was believed by 25% to be appropriate from employers only if they suspect wrongdoing however a slightly higher proportion (29%) said not at all. Only 7% of respondents felt this activity was acceptable from employers whenever they choose.
Chart 28. Attitudes towards employers monitoring employees’ telephone conversations
Q. I’m going to read you three statements. For each could you tell me if you think it’s appropriate behaviour for an employer to do whenever they choose, only if they suspect wrong-doing, for the safety and security of all employees, or not at all ? (Note, this statement was read to respondents at the same time as ‘surveillance’ and ‘monitoring of computer’)
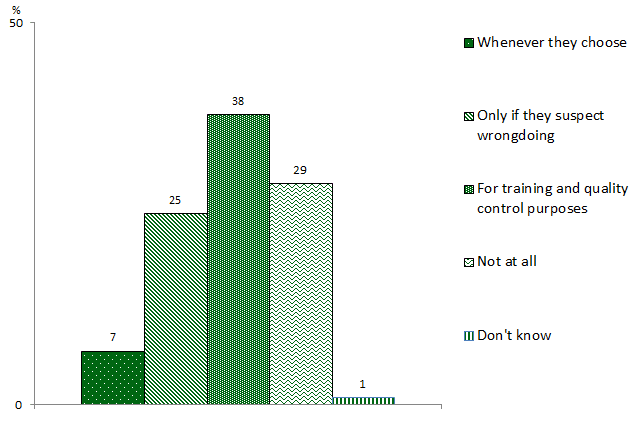
Base: Respondents giving single answer (n=1355)
Some respondents provided multiple responses to this question. For analysis purposes, only the answers of respondents who gave a single response are shown.
11.5 Importance of employer privacy policies
Respondents were asked how important they thought it was that employers had privacy policies that covered areas such as when employers would read work emails, randomly drug test employees, use surveillance equipment to monitor employees and monitor telephone conversations. In 2007, 86% thought privacy policies were important, slightly more than in 2004 (83%).
Respondents working in upper white collar occupations (90%) and those with a tertiary education (91%) were the groups most likely to think that employer privacy policies are important.
Chart 29. Importance of employer privacy policies
Q. How important is it to you that an employer has a privacy policy that covers when they will read employee emails, randomly drug test employees, use surveillance equipment to monitor employees and monitor telephone conversations
Base: All respondents (n=1503)
12.0 Privacy and the internet
In March 2007 there were 5.7 million household Internet subscribers and 761,000 business subscribers[4]. Internet usage is clearly widespread in the community. The ease of intercepting and duplicating information in digital format makes the Internet a medium of high potential risk for the exposure of personal information.
This section examines community attitudes regarding the provision of personal information in electronic format versus more traditional formats such as hard copy and telephone as well as people’s likelihood to provide false information as a means of protecting their personal information. Attitudes towards privacy policies on websites are also considered.
12.1 Levels of concern about personal information on the Internet
Respondents were asked to state their level of concern about providing information over the Internet:
- in general compared with two years prior;
- compared with providing hard copy information; and
- compared with providing information over the telephone.
Half (50%) were more concerned about providing information over the Internet than they were two years ago, with 31% as concerned and 11% less concerned. A higher proportion of younger Australians aged under 24 claimed to be less concerned than two years ago. However four times as many young Australians claimed to be more or as concerned than they were two years ago.
Chart 30. Levels of concern about personal information on the Internet compared with two years ago
Q. Are you MORE OR LESS concerned about the privacy of your personal information while using the Internet than you were two years ago?
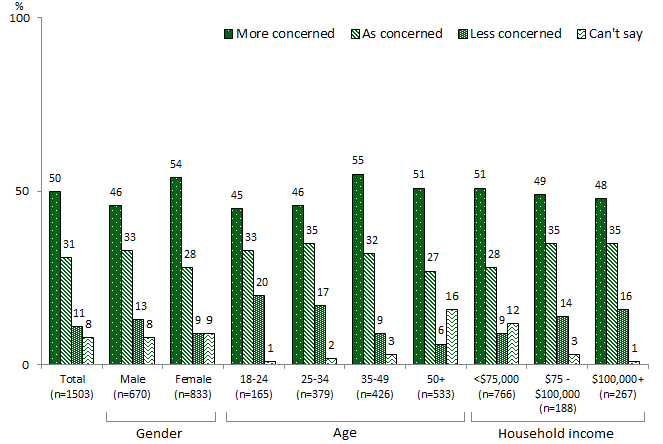
Base: All respondents (n=1503)
Reference to Charts 31 and 32 show that 65% of Australians feel more concerned about providing details online versus in hard copy format. The proportion feeling more concerned about providing details online versus over the telephone is lower at 45%. Conversely, only 6% of Australians feel less concerned using the Internet versus hard copy and one in eight (12%) feels less concerned using the Internet as opposed to the telephone. The conclusion that can be drawn is that Australians believe the Internet is not as secure as other more traditional means of providing information. These charts also show that a great deal of similarity exists in responses across age and income with the exception that people living in households earning over $75,000 seem to be slightly less daunted by giving information over the Internet than others.
Chart 31. Concern about providing personal information over the Internet versus in hard copy
Q. Are you more or less concerned about providing your personal details electronically or online compared to in a hard copy/paper based format?
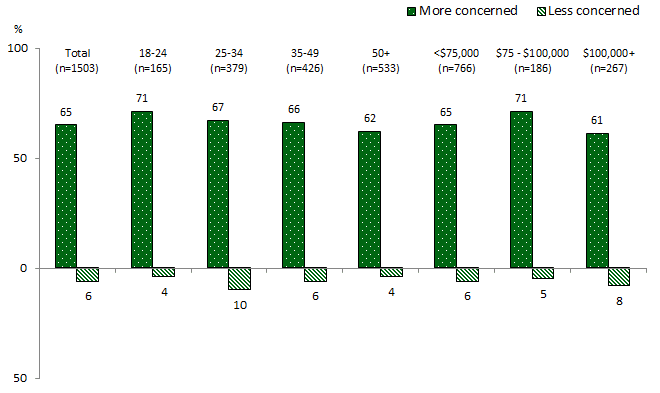
Base: All respondents (n=1503)
Chart 32. Concern about providing personal information over the Internet versus over the telephone
Q. And are you more or less concerned about providing your personal details electronically or online as opposed to over the telephone?
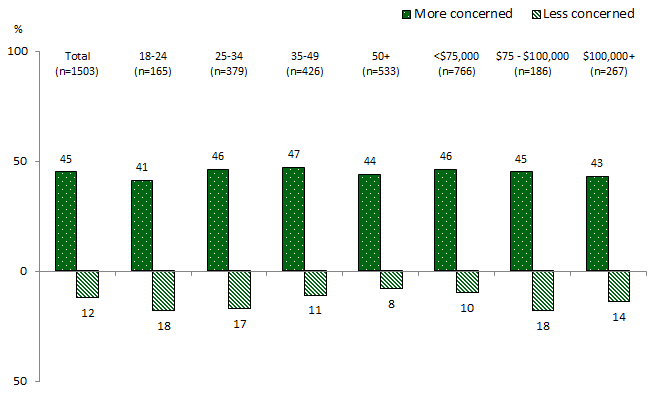
Base: All respondents (n=1503)
12.2 Providing false information online as a means of protecting privacy
Respondents were also asked how often they provide false information on forms and applications as a means of protecting their privacy. Most saw no need to do this (67%) and said they did not provide false information, however 25% did feel a need to protect themselves in this way.
The propensity to provide false information fell dramatically with increasing age, with 58% of Australians aged 18-24 years having provided false information, compared with 8% of those aged over 50.
Other groups who felt more need to provide false information were those:
- living in households earning over $100,000 (34%);
- living in metropolitan areas (33%);
- who are tertiary educated (30%); and
- males (30%).
Chart 33. Providing false information in online forms
Q. When completing online forms or applications that ask for personal details, have you ever PROVIDED FALSE INFORMATION as a means of protecting your privacy?
Base: All respondents (n=1503)
12.3 Use and impact of privacy policies on attitudes to websites
When asked whether they read privacy policies on websites, 33% said that they normally do. Respondents aged 25-34 (39%) were the most likely to do so, and females (36%) were more likely than males (30%) to read them.
Respondents who read privacy policies were asked what impact seeing the privacy policy had on their attitude to the website. The two most common responses were:
- it helps me decide whether or not to use the site (27%); and
- it makes me feel more confident and secure about using the site (25%).
13.0 Identity fraud
A range of organisations have listed identity fraud and theft as both a growing concern to the Australian public and a growing problem[5]. This study endorses this point of view with Australians being almost unanimous (96%) in saying that ID fraud or theft is an invasion of privacy.
Currently published crime statistics do not provide time series data or a baseline on the incidence of its occurrence. In recognition of this, the Australian Bureau of Statistics is introducing a survey of Personal Fraud victimisation as an adjunct to its regular Crime Victimisation Survey collections. The pilot for this study was conducted in February-March of 2007 and the results of the survey, which is in field at time of writing (July to December, 2007) will be available in 2008.
As this is a relatively new area of investigation, respondents were read the following introductory statement before being asked questions on the subject
I’m now going to ask you a few questions about providing photo identification and identity fraud and theft. By identity fraud and theft I mean where an individual obtains your personal information (eg. credit card, drivers licence, passport or other personal identification documents) and uses these to fraudulently obtain a benefit or service for themselves.
13.1 Incidence of ID fraud and theft
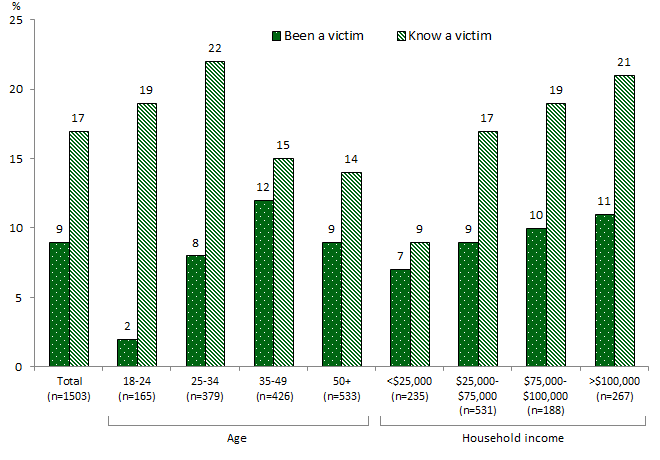
Respondents were asked whether they or someone they know has been the victim of ID fraud or theft. Overall 9% of Australians claimed they had been the victim themselves and 17% knew someone who had been the victim.
Generally speaking, the likelihood of being a victim is highest amongst people working in upper white collar professions, amongst those aged between 25 and 49, and amongst Western Australians. The characteristics of those who know someone who has been the victim are less well defined as a broader snapshot of the community fits into this category.
More details are shown in Chart 34 which identified the following factors are being influential in underpinning Australians’ likelihood of being a victim or knowing someone personally who has been:
Age — people aged 35 – 49 are the group most at risk themselves (12%) and to know someone who has been the victim (22%), with those aged under 24 (2%) being the least likely to have been a victim, but quite likely to know someone who has been (19%).
Location — Western Australians reported a significantly higher incidence of being the victim of ID fraud and theft (14%).
Employment — people who are employed (especially if full-time) are more likely to know someone that has been the victim of this type of crime (18%).
Household income — the likelihood of knowing someone who have been the victim of ID fraud or theft increases with increasing household income (to 21% of people living in households earning more than $100,000).
Chart 34. Incidence of being the victim or personally knowing a victim of ID fraud/theft
Q. Have you or someone you personally know ever been the victim of identity fraud or theft?
Base: All respondents (n=1503)
The majority of Australians are concerned about becoming a victim of identify fraud or theft, with 60% saying they are concerned, and 17% of this total saying they are very concerned. Not surprisingly, the profile of those displaying the highest levels of concern matches the profile of those who have been victims, while those displaying the least concern do not coincide with those showing high concern levels. Western Australians hold polarised views on this issue with citizens either being more likely to be very concerned or not concerned at all.
People living in middle income households ($25 – $100,000) are the most concerned. Those earning less or more still show signs of concern but at reduced levels.
13.2 Activities that most easily allow identity fraud or theft to occur
The Australian Federal Police and the Attorney-General’s Department, amongst others, have produced consumer guides aimed at reducing or eliminating identity fraud and theft. These guides suggest the two key ways in which an identity may be stolen are:
- Physical loss or theft of personal documentation (wallet, credit and other ID); and
- Interception of mail containing personal information – both electronic and physical. Respondents were asked for their views.
Table 7. Respondents’ views on ways in which identity fraud and theft can occur most easily
Q. What activities do you think most easily allow identity fraud or theft to occur?
| Activities that allow ID theft to occur | Total (n=1,503) % |
|---|---|
| Using the internet in general | 27 |
| Buying items online | 11 |
| Online Banking | 11 |
| Net mentions of Internet/online[*] | 45 |
| Losing/having ID, wallet, passport and other documentation stolen | 22 |
| Using credit card/losing sight of card | 20 |
| Giving out too much personal information to organisations and businesses | 19 |
| Having documentation stolen from mailbox or bin | 14 |
| Using ATMS/teller machines/EFTPOS | 7 |
| Buying items over the phone | 3 |
| Other | 4 |
| Don’t know | 4 |
Base: all respondents
[*] This is a multiple response question. The nett figure shown is the proportion of all respondents who mentioned one of more of the three categories above it.
In aggregate, concerns about the possibility of identity fraud and theft over the Internet increase with increasing income. Amongst people living in households earning over $100,000, 52% nominated one or more ways that identity fraud of theft could occur via this medium.
Given they were the most likely to report being the victims of identity fraud and theft, it is interesting to note that Western Australians were significantly more likely than others to offer a don’t know response to this question (7%). Concern about using credit cards increases with age as does concern over online banking, to the point where people aged over 50 have significantly different views to those aged under 25.
13.3 Showing and copying identification documents
Respondents were asked whether they considered it was reasonable either to show identification documents or to have a copy of those documents made in a range of situations. Their responses are shown in Chart 35.
Chart 35. Acceptability of having to show identification documents or have them copied
Q. Do you think it is acceptable that you need to show / copy identification documents (such as a drivers license or passport) in the following situations:
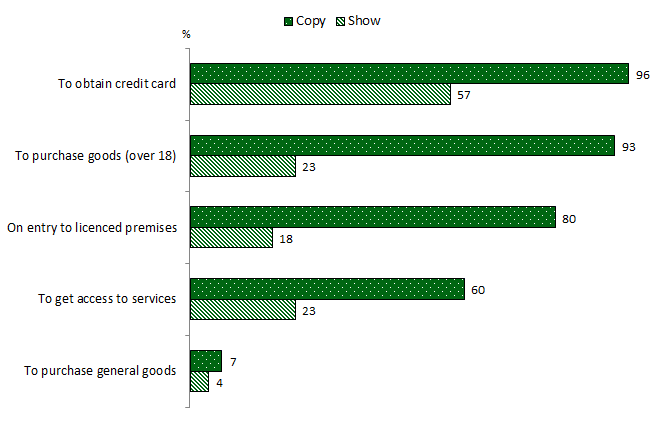
Base: All respondents (n=1503)
In all cases, the proportion believing that it is acceptable for copies of documents to be made is significantly lower than agrees it is acceptable for them to be shown.
The requirement to show identification documents to purchase everyday goods, clearly, would not be acceptable to the majority of Australians. However, the majority supports showing documentation for the other ideas put to them.
Support for showing identification documents on entry to a licensed premises and for purchasing goods that require the purchaser to be an adult declines with increasing age. Support levels are otherwise very similar across the country and respondents of all types.
The majority only support making a copy of identification documents for credit card applications. Otherwise acceptance levels are below a quarter of the population and similar across all types of respondent.
Support for copying documents is only acceptable to the majority for obtaining credit cards. For this activity 57% of Australians agrees that copying identification documentation is acceptable. Support drops dramatically with only 23% supporting copying documentation to purchase goods that requires the purchaser to be over 18, or get access to services. Support falls further to 18% to gain entry to licensed premises and only 4% support having documents copied to purchase general goods.
14.0 Privacy in public places — CCTV
Most Australians (92%) are aware of closed-circuit television (CCTV). Given their greater likelihood to be in places with CCTV installed (pubs, nightclubs, restaurants, bars and throughout the public transport system) it is interesting that 88% of Australians aged under 24 are aware. The fact that many of this group had not completed Year 12 and/or earn under $25,000 suggests that at least some of them may still be high school students.
14.1 Awareness and concerns about CCTV
Awareness of CCTV increases with increasing household income, education and socio-economic standing.
Chart 36. Awareness of CCTV
Q. Are you aware of or have you seen CCTV cameras?
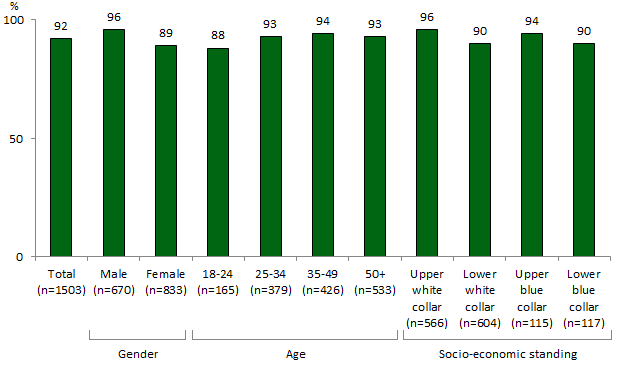
Base: All respondents (n=1503)
Amongst those aware of CCTV cameras, 79% are not concerned about their use in public places. Concern lessens with increasing age. Victorians show higher levels of concern than other Australians. Although 80% of Victorians say they are not concerned, 16% are somewhat concerned – higher than across the rest of Australia. The proportion of people who are very concerned is stable across the country at less than 5%.
Given the generally low levels of concern, only 203 respondents in total were asked to enunciate their main concerns. These are shown in Table 8 and cannot be analysed in any more depth owing to the small number of respondents in segments such as state and even age. There are sufficient men and women answering this question to compare their responses. Reference to the Table shows that men are much more concerned that taped footage may be misused than women, otherwise their concerns are similar.
Table 8. Concerns about CCTV
Q. What is your main concern?
| CCTV concerns | Total (n=203) % | Men (n=117) % | Women (n=87) % |
|---|---|---|---|
| Information may be misused | 54 | 60 | 45 |
| Invasion of privacy | 45 | 42 | 49 |
| It makes me uncomfortable | 13 | 13 | 13 |
| Not effective in stopping crime/false sense of security | 4 | 3 | 5 |
| Other | 4 | 4 | 4 |
| Don’t know | 2 | 2 | 3 |
Base: concerned about CCTV (n=203)
Note that respondents were asked for one answer, but some gave more than one — therefore percentages do not add to 100.
14.2 Access to CCTV footage
Respondents were asked which organisations should have access to CCTV footage. Even those with concerns about CCTV, offered suggestions for appropriate use. On average, respondents were able to suggest 1.74[6] organisations each that they believed should have access. Responses were similar amongst Australians from all walks of life.
The organisation mentioned most that should have access was the police (88%), with support increasing significantly amongst Australians aged 25 and over. Whereas 75% of 19–24 year olds nominated the police, 86% of 25 – 35 year olds, rising to 91% of Australians aged over 50, nominated the police. Otherwise levels of agreement that the police should have access were consistent across respondents of all types.
Support for other organisations accessing footage was considerably lower. Security companies were nominated by 20%. Once again, support levels were similar across most types of Australians, with several notable exceptions – people who are not working are significantly more likely to nominate these organisations (26%), as are sales people and skilled workers (25% and 30% respectively). Chart 37 shows that 15% nominated the government, 13% anti-terrorist agencies and 11% nominated the company that installed the camera.
Although only 61 students were interviewed, they had significantly different views from other Australians in that they are less likely to nominate the police as an organisation that should access CCTV footage (76%) and more likely to say that government (28%), anti-terrorism law enforcement agencies (12%) and everyone (6%) should have access.
Chart 37. Organisations that should have access to CCTV footage
Q. Which organisation or organisations, if any, do you think should have access to what has been recorded on CCTV cameras?
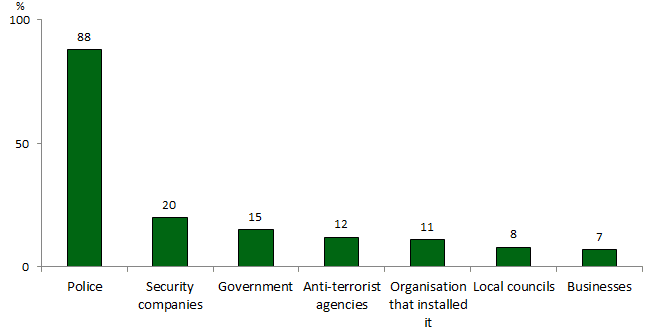
Base: Aware CCTV (n=1387)
Note responses of less than 5% have been omitted – these included the courts and emergency services (3% each), law enforcement/crime prevention services (2% each) and 2% other responses. 2% were unable to answer, but no- one responded ‘none’
14.3 Appropriate positioning of CCTV cameras
When asked where it would be appropriate to place CCTV cameras, 9% were happy to place them anywhere with the exceptions of residential homes, bathrooms and changing places. Once again, no respondents said that CCTV cameras should not be placed anywhere, even those who showed concerns about them. Overall, Australians nominated two places each.
Chart 38. Places where it is appropriate for CCTV cameras to be installed
Q. Where it is appropriate to have CCTV cameras?
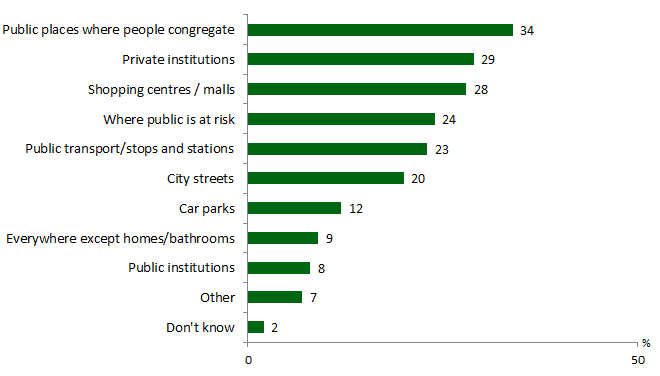
Base: Aware CCTV (n=1387)
Not only were Australians happy to nominate public spaces, but also 29% nominated private institutions including banks, entertainment venues, pubs and clubs. Support for placing CCTVs in private institutions increased with increasing age with people aged over 50 (32%) being significantly more likely than younger Australians (25% amongst those aged under 35) to suggest these venues. Across the country support was highest amongst Victorians and Tasmanians (35% and 39% respectively).
Support was fairly uniform across the country and by respondents of all types for positioning CCTV cameras in locations where people gather and may be at risk. While all respondents suggested placing CCTV cameras in Shopping Centres (28%), people living outside the main metropolitan areas (33%) and in the states of Tasmania (54%) and Queensland (36%) were the most likely to nominate these. People using public transport more than others (18 – 24 year olds (32%) and people living in metropolitan areas and the states of Victoria, New South Wales and Western Australia) were the most likely to agree with placing CCTV cameras in stations, at bus or tram stops and at the airport. Respondents were more reticent to suggest placing CCTV cameras in public institutions such as government offices, hospitals, schools, police stations and the like.
Appendix 1: Verification Study
A Verification Study was conducted to ensure that responses to questions in the main survey were accurate and representative of the broader community. Concerns had been raised in the past that contextual bias could enter the questionnaire as respondents were primed by previous questions to provide answers that may not have reflected their view when asked questions in isolation.
The Verification Study consisted of three questions from the main survey. It was conducted as part of NewsPoll’s Omnibus, a multi-client survey, between 3 and 7 August 2007. The sampling structure of the Omnibus was similar to that used for the main survey and 1,200 Australians over 18 years of age were interviewed by telephone.
On the whole, responses were in line with the results of the main study except for the question on awareness of CCTV. This question was included because the following question on concerns about the use of CCTV in the main survey had only been asked of those who were aware of CCTV. There was a 22% discrepancy, with respondents of the Verification study (70%) being much less likely to be aware of CCTV than in the main survey (92%). One explanation for this is that respondents to the main survey answered the CCTV section last and were, by that point, quite attuned to privacy issues. In particular the ‘privacy in the workplace’ section had already asked about surveillance equipment. Also the introduction to the CCTV section was more detailed than the brief introduction in the verification study. The introductions were as follows:
Main survey
The last topic I’d like your opinions on is Closed Circuit Television (CCTV). I’m talking about cameras that are used to monitor PUBLIC SPACE for example inner city streets, parks and car parks. Are you aware of or have you seen CCTV cameras?
Verification survey
Thinking now about Closed Circuit Television, also know as CCTV Are you aware of or have you seen CCTV cameras?
With this exception, responses fell within the expected range of sampling error, including those relating to concern about the use of CCTV cameras.
Concern about personal information being sent overseas
Q. How concerned are you about Australian businesses sending their customers’ personal information overseas to be processed?
| Response | Privacy Survey 2007 % | Verification Study (NewsPoll Omnibus) % | Difference % |
|---|---|---|---|
| Very Concerned | 63 | 66 | 3 |
| Somewhat Concerned | 27 | 23 | -4 |
| Not concerned | 9 | 10 | 1 |
| Don’t know | 1 | 1 | 0 |
Have been or know someone who has been the victim of identity theft or fraud
Q. Now I’d like to ask you about identity fraud. By identity fraud and theft I mean where an individual obtains your personal information such as credit card, driver’s licence, passport or other personal identification documents and uses these to obtain a benefit or service for themselves fraudulently. Have you, or someone you personally know, ever been the victim of identity fraud or theft?
| Response | Privacy Survey 2007 % | Verification Study (NewsPoll Omnibus) % | Difference % |
|---|---|---|---|
| Yes, you | 9 | 8 | -1 |
| Yes, someone you know | 17 | 14 | -3 |
| No | 75 | 78 | 3 |
| Don’t know | <1 | <1 | 0 |
Aware of CCTV cameras
Q. Thinking now about Closed Circuit Television, also know as CCTV. Are you aware of or have you seen CCTV cameras?
| Response | Privacy Survey 2007 % | Verification Study (NewsPoll Omnibus) % | Difference % |
|---|---|---|---|
| Yes | 92 | 70 | -22 |
| No | 7 | 29 | 22 |
| Don’t know | <1 | 2 | 0 |
Concern about the use of CCTV cameras
Q. How concerned are you about the use of CCTV cameras in public spaces? Are you…?
| Response | Privacy Survey 2007 % | Verification Study (NewsPoll Omnibus) % | Difference % |
|---|---|---|---|
| Very Concerned | 3 | 5 | 2 |
| Somewhat Concerned | 11 | 12 | 1 |
| Not concerned | 85 | 83 | -2 |
| Don’t know | <1 | 1 | <1 |
Appendix 2: Questionnaire
Wallis Consulting Group – Office of the Privacy Commissioner
2007 COMMUNITY ATTITUDES RESEARCH
FINAL QUESTIONNAIRE – 5th July
Good [Morning/ Afternoon/ Evening], my name is (SAY NAME) from Wallis Consulting Group. Today we are conducting an important survey on behalf of the Office of the Privacy Commissioner on the protection and use of people’s personal information by businesses and other organisations. All views are of interest to us and results may be used to help better protect consumers’ privacy in the future. Your answers will be strictly confidential and used as statistics only. The interview will take between 20 and 30 minutes on average depending on your answers and this is your chance to have your say on matters relating to privacy.
To ensure we speak to a representative sample of the population, we would like to speak with someone in the household aged 18 years or over.
IF NOT A CONVENIENT TIME NOW MAKE APPOINTMENT
IF ASKS HOW DID YOU GET MY NUMBER, SAY: Your number was selected randomly from the white pages phone book.
IF RESPONDENT WANTS FURTHER INFORMATION, SAY: You can find out more about this survey from our website (www.wallisgroup.com.au) or you may contact the Office of the Privacy Commissioner on 1300 363 992, during business hours.
This call may be monitored for quality control purposes. Is that OK with you?
- Yes1
- No2 Mark accordingly
We’d prefer that you answer all the questions, but if there are any that you don’t want to answer, that’s fine, just let me know.
S1. Sex. Record sex of respondent
- Male1
- Female2
S2. Before we begin, to ensure we are interviewing a true cross-section of people, would you mind telling me which of the following age groups you belong to? (READ OUT)
- 18-24 1
- 25-29 2
- 30-34 3
- 35-44 4
- 45-49 5
- 50-54 6
- 55-64 7
- 65+ 8
- (DON’T READ) REFUSED 9 Terminate
Check quotas
Main questionnaire
General attitudes to providing personal information
Q1. Firstly, have you ever decided NOT TO DEAL with a PRIVATE COMPANY or CHARITY because of concerns over the protection or use of your personal information?
- Yes 1
- No 2
- Can’t say 3
Q2. Have you ever decided NOT TO DEAL with a GOVERNMENT DEPARTMENT because of concerns over the protection or use of your personal information?
- Yes 1
- No 2
- Can’t say 3
Q3. When completing forms or applications that ask for personal details, such as your name, contact details, income, marital status etc, how often, if ever, would you say you leave some questions blank as a means of protecting your personal information? Would that be …(READ OUT)?
- Always1
- Often2
- Sometimes3
- Rarely4
- Never5
- Can’t say6
Q4. When providing your personal information to any organisation, IN GENERAL, what types of information do you feel RELUCTANT to provide? [IF NECESSARY For example, (ROTATE) your name, address, phone number, financial details, income, marital status, date of birth, email address, medical information, genetic information, or something else] What else?(MULTI)
If more than one
Q5. And of [LIST ANSWERS IN Q4] which ONE of these do you feel MOST RELUCTANT to provide? (SINGLE)
- Name 1
- Home Address 2
- Home phone number 3
- Financial details such as bank account 4
- Details about your income 5
- Marital status 6
- Date of Birth 7
- E-mail address 8
- Medical history/health information 9
- Genetic information 10
- Religion 11
- How many people or males in household/family member details 12
- Other (Specify) 97
- CAN’T SAY/ IT DEPENDS 98
- None of these 99
If more than one response on Q4, ask:
If mentioned type of information, or depends on type of information (codes 1 to 98 on Q3), ask:
Q6. And what is your MAIN reason for not wanting to provide your [ANSWER FROM Q5]?
- May lead to financial loss/people might access bank account 1
- It’s none of their business/Invasion of privacy 2
- Discrimination 3
- I do not want to be identified 4
- I do not want people knowing where I live or how to contact me 5
- The information may be misused 6
- Information might be passed on without my knowledge 7
- Don’t want junk mail/unsolicited mail SPAM 8
- I don’t want to be bothered/hassled/hounded by phone or door to door 9
- For safety/security/protection from crime) 10
- Unnecessary/irrelevant to their business or cause 11
- Other (SPECIFY) 97
- Can’t say 98
Ask everyone
Q7. Which of the following statements BEST DESCRIBES how you GENERALLY feel when organisations that you have NEVER DEALT WITH BEFORE send you unsolicited marketing information? Would you say...(READ OUT) (MULTI)?
- I feel angry and annoyed1
- I feel concerned about where they obtained my personal information2
- It doesn’t bother me either way, I don’t care3
- It’s a bit annoying but it’s harmless4
- I enjoy reading the material and don’t mind getting it at all5
- Fixed openend or something else (SPECIFY)97
- Fixed Single (DON’T READ) CAN’T SAY98
Trust in organisations handling personal information
The next few questions concern the type of public information that should or should not be available to businesses for marketing purposes.
Q8. How trustworthy or untrustworthy would you say the following organisations are with regards to how they protect or use your personal information? IF TRUSTWORTHY: Is that highly trustworthy or somewhat trustworthy? IF UNTRUSTWORTHY: Is that highly untrustworthy or somewhat untrustworthy?
| ROTATE | Highly Trustworthy | Somewhat Trustworthy | Neither (DNR) | Somewhat untrustworthy | Highly untrustworthy | Can’t say |
|---|---|---|---|---|---|---|
| a) Financial institutions | 1 | 2 | 3 | 4 | 5 | 6 |
| b) Real Estate Agents | 1 | 2 | 3 | 4 | 5 | 6 |
| c) Insurance Companies | 1 | 2 | 3 | 4 | 5 | 6 |
| d) Charities | 1 | 2 | 3 | 4 | 5 | 6 |
| e) Government Departments | 1 | 2 | 3 | 4 | 5 | 6 |
| f) Health service providers including doctors, hospitals and pharmacists | 1 | 2 | 3 | 4 | 5 | 6 |
| g) Market research organisations | 1 | 2 | 3 | 4 | 5 | 6 |
| h) Retailers | 1 | 2 | 3 | 4 | 5 | 6 |
| i) Businesses selling over the internet | 1 | 2 | 3 | 4 | 5 | 6 |
ROTATE 9 and 9b
Q9. GENERALLY, how likely or unlikely would you be to provide your personal information to an organisation if it meant you would receive discounted purchases? Is that very or quite…
AND
Q9b. and how about if it meant you would have a chance to win a prize? Is that very or quite…
- Very likely1
- Quite likely2
- Neither likely or unlikely (DO NOT READ)3
- Quite unlikely4
- Very unlikely5
- Can’t say (DO NOT READ)6
- Depends (DO NOT READ)7
Level of knowledge
The next few questions are about the Federal Privacy Act and what you believe is covered by it.
Q10. Firstly, I’m going to list six types of organisations. Which of these, if any, do you think GENERALLY must operate under the Federal Privacy Act? (MULTI)
- State Government departments1
- Commonwealth Government departments2
- Small businesses3
- Large businesses4
- Charities5
- None of them6
- Businesses based overseas7
Q11. Which of the following activities, if any, would be against the Federal Privacy Act? (RANDOM)
- Your neighbours spying on you1
- An individual steals your ID and uses it to pretend that they are you2
- A small business reveals a customer’s information to other customers3
- A large business reveals a customer’s information to other customers4
- A bank or other organisation sends customer data to an overseas processing center5
Q12. Were you aware of the Federal PRIVACY LAWS before this interview?
- Yes1
- No2
- Can’t say3
Q13. If you wanted to report the misuse of your personal information, who would you be most likely to contact? (DO NOT READ OUT) Anyone else? (MULTI)
- Police1
- Ombudsman2
- The organisation that was involved3
- The Privacy Commissioner (Federal or State)4
- Consumer Affairs (in your state)5
- Local State MP6
- State government department7
- Local Council8
- Lawyers/solicitors9
- Department of Fair Trading10
- The media eg TV/ radio/ newspapers11
- Seek advice from a friend or relative12
- Other (SPECIFY)97
- CAN’T SAY (if none)98
Ask if Q13 code 12
Q13a Is that friend or relative a professional in a relevant field?
What is it?
- Police1
- Ombudsman2
- The organisation that was involved3
- The Privacy Commissioner (Federal or State)4
- Consumer Affairs (in your state)5
- Local State MP6
- State government department7
- Local Council8
- Lawyers/solicitors9
- Department of Fair Trading10
- The media eg TV/ radio/ newspapers11
- No12
- Other (SPECIFY)97
- CAN’T SAY (if none)98
Q14. Are you aware that a Federal Privacy Commissioner exists to uphold privacy laws and to investigate complaints people may have about the misuse of their personal information?
- Yes1
- No2
- Can’t say3
Government
The next questions cover Government Departments and privacy
Q15. If it was suggested that you be given a unique number to be used for identification by ALL Commonwealth Government departments and to use ALL government services, would you be in favour of this? Is that strongly or partly?
- Strongly in favour1
- Partly in favour2
- Neither in favour or against it (DO NOT READ)3
- Partly against4
- Strongly against5
- Can’t say (DO NOT READ)6
Q16. Do you believe government departments should be able to cross-reference or share information in their databases about you and other Australians for:
- Any Purpose1
- Some Purposes2
- Not At All3
- Can’t Say4
If some purposes (code 2 in Q16), ask, otherwise go to Q17:
Q16a. For which of the following purposes do you believe governments should be allowed to cross reference your personal information? Should they be allowed to cross-reference information for… (READ OUT)
| ROTATE | Yes | No | Don’t know |
|---|---|---|---|
| Updating information like contact details | 1 | 2 | 3 |
| To prevent of solve fraud or other crime | 1 | 2 | 3 |
| To reduce costs or improve efficiency | 1 | 2 | 3 |
Ask everyone
Q17. Which of the following instances would you regard to be a misuse of your personal information?
| ROTATE | Yes (invasion of privacy) | No | Don’t know |
|---|---|---|---|
| a) a government department that you haven’t dealt with gets hold of your personal information | 1 | 2 | 3 |
| b) a Government department monitors your activities on the Internet, recording information on the sites you visit without your knowledge | 1 | 2 | 3 |
| c) You supply your information to a Government department for a specific purpose and the agency uses it for another purpose. | 1 | 2 | 3 |
| d) A Government department asks you for personal information that doesn’t seem relevant to the purpose of the transaction. | 1 | 2 | 3 |
Privacy and businesses
Q19. I would like you now to think about your privacy and businesses. I’m going to read you a number of statements and I’d like you to tell me whether you agree or disagree with each. Do you agree or disagree… Is that strongly or partly
| ROTATE | Strongly agree | Partly agree | Neither (DNR) | Partly disagree | Strongly disagree | Can’t say (DNR) |
|---|---|---|---|---|---|---|
| a) businesses should be able to use the electoral roll for marketing purposes | 1 | 2 | 3 | 4 | 5 | 6 |
| b) businesses should be able to collect your information from the White Pages telephone directory without your knowledge for the purposes of marketing | 1 | 2 | 3 | 4 | 5 | 6 |
Q18 Which of the following instances would you regard to be a misuse of your personal information?
| ROTATE | Yes (invasion of privacy) | No | Don’t know |
|---|---|---|---|
| a) a business that you don’t know gets hold of your personal information | 1 | 2 | 3 |
| b) a business monitors your activities on the internet, recording information on the sites you visit without your knowledge. | 1 | 2 | 3 |
| c) You supply your information to a business for a specific purpose and the business uses it for another purpose. | 1 | 2 | 3 |
| d) A business asks you for personal information that doesn’t seem relevant to the purpose of the transaction. | 1 | 2 | 3 |
Q21. How concerned are you about Australian businesses sending their customers’ personal information overseas to be processed? (READ OUT)
- Very concerned1
- Somewhat concerned2
- Not concerned3
- Can’t say4
Health information
The next few questions concern medical or health information and privacy.
Q22. When do you think your doctor should be able to share your health information with other doctors or health service providers, such as (ROTATE: pharmacists, specialists, pathologists or nurses)? (READ OUT)
- For anything to do with my health care1
- Only for purposes that are related to the specific condition being treated2
- Only for serious or life threatening conditions3
- For no purpose, they should always ask for my consent4
- Don’t know/Can’t say (DO NOT READ)5
Q23. Do you agree or disagree that…?
Your doctor should be able to discuss your personal medical details with other health professionals - in a way that identifies you - WITHOUT YOUR CONSENT if they believe this would assist your treatment? Is that strongly or partly…
- Strongly agree1
- Partly agree2
- Neither agree or disagree (DO NOT READ)3
- Partly disagree4
- Strongly disagree5
- Can’t say (DO NOT READ)6
Q24. The idea of building a National Health Information Network has been put forward. If this existed it would be an Australia-wide database which would allow medical professionals anywhere in Australia to access a patient’s medical information if it was needed to treat a patient. The information could also be used on a de-identified basis to compile statistics on the types of treatments being used, types of illnesses suffered and so on…
If such a database existed, do you think inclusion of your medical information should be VOLUNTARY, or should ALL MEDICAL RECORDS be entered without permission or consent?
- Inclusion should be voluntary1
- All medical records should be entered2
- Other (SPECIFY)97
- CAN’T SAY98
Q25. Health information is often sought for research purposes and is generally de-identified - that is, NOT linked with information that identifies an individual. Do you believe that an individual’s permission should be sought before their de-identified health information is released for research purposes, or not?
- Yes1
- No2
- Maybe3
- Can’t say4
Q26. If a person has a serious genetic illness, under what circumstances do you think it is appropriate for their doctor to tell a relative so the relative could be tested for the same illness: Should doctors tell their relatives… (SINGLE) (READ OUT)
- Without the patient’s consent, even if it’s unlikely that the relative may have the condition?1
- Without the patient’s consent, but if there is strong possibility of the relative also having the condition?2
- If the patient consents to their relative being told3
- Don’t know/ can’t say (DO NOT READ)4
Employee privacy
Now for a few questions about employees’ privacy in the workplace
Q27. Do you think that employees should have access to the information their employer holds about them?
- Yes1
- No2
- Can’t say3
Q28. I’m going to read you three statements. For each could you tell me if you think it’s appropriate behaviour for an employer to do whenever they choose, only if they suspect wrong-doing or not at all.
| ROTATE | Whenever they choose | Only if suspect wrongdoing | Not at all | Can’t say (DNR) |
|---|---|---|---|---|
| a) Read e-mails on a work e-mail account | 1 | 2 | 3 | 4 |
| b) Randomly drug and alcohol test employees | 1 | 2 | 3 | 4 |
| c) Monitor an employees work vehicle location (eg using GPS) | 1 | 2 | 4 | 4 |
Q29a. I’m going to read you another three statements. This time could you tell me if you think it’s appropriate behaviour for an employer to do whenever they choose, only if they suspect wrong-doing, only for the safety or security of employees or not at all. (SINGLE)
| ROTATE | Whenever they choose | Only if suspect wrongdoing | Safety/ Security | Not at all | Can’t say (DNR) |
|---|---|---|---|---|---|
| a) Use surveillance equipment such as video and audio cameras to monitor the workplace | 1 | 2 | 3 | 4 | 5 |
| b) Monitor everything an employee types into their computer, including what web sites they visit and what they type in e-mails | 1 | 2 | 3 | 4 | 5 |
Q29b. And finally, do you think it’s appropriate behaviour for an employer to monitor telephone conversations…?.(READ OUT).
- Whenever they choose1
- Only if they suspect wrongdoing2
- For training and quality control; or3
- Not at all4
- Can’t say (DO NOT READ)5
Q30. How important is it to you that an employer has a privacy policy that covers when they will read employee emails, randomly drug test employees, use surveillance equipment to monitor employees and monitor telephone conversations. Is it …(READ OUT)?
- Not at all important1
- Not very important2
- Quite important3
- Very important4
- Can’t say (DO NOT READ)5
Internet
Now I’d like to ask you a few questions about using the internet and giving personal information over it.
Q31. Are you more or less concerned about providing your personal details electronically or online compared to in a hard copy/paper based format? …
- More concerned1
- Less concerned2
- As concerned3
- Can’t say (DO NOT READ)4
Q32. And are you more or less concerned about providing your personal details electronically or online as opposed to over the telephone?
- More concerned1
- Less concerned2
- As concerned3
- Can’t say (DO NOT READ)4
Q33. When completing online forms or applications that ask for personal details, have you ever PROVIDED FALSE INFORMATION as a means of protecting your privacy?
- Yes1
- No2
- Can’t say3
Q34. Are you MORE OR LESS concerned about the privacy of your personal information while using the internet than you were two years ago?
- More concerned1
- Less concerned2
- As concerned3
- Can’t say (DO NOT READ)4
Q35. Do you normally read the privacy policy attached to any internet site?
- Yes1
- No2
- Can’t say3
If seen or read privacy policy (code 1 in Q35), ask, otherwise go to Q27
Q36. What impact, if any, did seeing or reading these privacy policies have upon your attitude towards the site? (DO NOT READ) (MULTI)
- It’s a good idea/ I approve of the privacy policy/ they are doing the right thing/ prefer to see on sites/ respect sites for having it1
- Feel more confident/comfortable/secure/ about using site2
- Appear more honest/trustworthy/responsible/legitimate3
- Helps me decide whether to use the site or not4
- Still apprehensive about sites that have them/Don’t trust them/ not convinced5
- Made me more cautious/aware when using the internet generally6
- Too long/complicated to read7
- Other (Specify)97
- Can’t say98
- None/no99
ID theft
I’m now going to ask you a few questions about providing photo identification and identity fraud and theft. By identity fraud and theft I mean where an individual obtains your personal information (eg. credit card, drivers licence, passport or other personal identification documents) and uses these to fraudulently obtain a benefit or service for themselves.
Q37. Do you think it is acceptable that you need to show identification documents (such as a drivers license or passport) in the following situations: (MULTI - RECORD IF ANSWER YES - acceptable)
- On entry to licensed premises (eg Pub/Club/Hotel)1
- To obtain a credit card2
- To purchase general goods (eg clothing and food)3
- To purchase goods for which you need to be over 18 eg Cigarettes4
- To get access to services5
Q38. Do you think it is acceptable that a copy of your identification documents (such as a drivers license or passport) is made in the following situations:
- On entry to licensed premises (eg Pub/Club/Hotel)1
- To obtain a credit card2
- To purchase general goods (eg clothing and food)3
- To purchase goods for which you need to be over 18 eg Cigarettes4
- To get access to services5
Q39. Have you (or someone you personally know) ever been the victim of identity fraud or theft?
- Yes – it happened to me1
- Yes it happened to someone I personally know2
- No3
- Can’t say4
Q40. How concerned are you that you may become a victim of identity fraud or theft in the next 12 months? (READ OUT)
- Very concerned1
- Somewhat concerned2
- Not concerned3
- Can’t say (DO NOT READ)4
Q41. Do you consider ID fraud or theft to be an invasion of privacy?
- Yes 1
- No 2
- Can’t say 3
Q42. What activities do you think most easily allow identity ID fraud or theft to occur?
OPEN
CCTV
The last topic I’d like your opinions on is Closed Circuit Television (CCTV). I’m talking about cameras that are used to monitor PUBLIC SPACE for example inner city streets, parks and car parks.
Q43. Are you aware of or have you seen CCTV cameras?
- Yes 1
- No 2 Go to Demos
- Can’t say 3 Go to Demos
Q44. How concerned are you about the use of CCTV cameras in public spaces, are you (READ OUT)…?
- Very concerned1
- Somewhat concerned2
- Not concerned3
- Can’t say4
Ask if concerned
Q45. What is your main concern? (DO NOT READ)
- Invasion of privacy1
- Information may be misused2
- It makes me uncomfortable3
- Other (specify)4
- Can’t say5
Q46. Which organisation or organisations, if any, do you think should have access to what has been recorded on CCTV cameras? (MULTI) (DO NOT READ)
- Everyone1
- Police2
- Anti-terrorism law enforcement agencies3
- Local Councils4
- Government5
- Security companies6
- Businesses7
- The courts8
- The organisation that installed them9
- Other (specify)10
- Can’t say11
Q47. Where is it appropriate to have CCTV cameras?. OPEN (PROBE)
Demographics
Finally, a few questions about yourself, just to ensure we have spoken to a representative cross section of people.
D1. What is the highest level of education you have reached?
- Primary school1
- Intermediate (year 10)2
- VCE/HSC (year 12)3
- Undergraduate diploma/TAFE/Trade certs4
- Bachelor’s Degree5
- Postgraduate qualification6
- CAN’T SAY7
D2. Are you now in paid employment?
IF YES, ASK: Is that FULL-time for 35 hours or more a week, or part-time?
IF NO, ASK: Are you retired or a student?
- Yes, Full-time1
- Yes, part time2
- No, retired3
- No, student4
- Other non-worker5
- Refused6
Ask if working full/part time
D3. Are you employed by someone else or are you an employer?
- Employee1
- Employer2
- Self-employed/SOHO3
- Both4
- Can’t say5
D4. What is your (last) occupation?
(OPEN – code to ANZSCO standard)
D5. Which describes your household income before tax, best?
- Less than $25,0001
- $25-75,0002
- $75 - 100,0003
- Over $100,0004
- Refused (do not read)5
Closing Statements — All
Thank you very much for your time. Your views count and on behalf of the Office of the Privacy Commissioner and Wallis Consulting Group, I’m very glad you made them known. In case you missed it, my name is ............... from Wallis Consulting Group. The information you have provided cannot be linked to you personally in any way.
If you have any queries about this study you can call the Australian Market and Social Research Society’s free survey line on 1300 364 830.
Long text descriptions
Chart 1. Awareness of federal privacy laws
Chart 1 illustrates the responses to the question, 'Were you aware of the federal PRIVACY LAWS before this interview?'. The chart is broken down by gender, age and location. Out of a total 1503 respondents, 69% said yes, 30% said no and 1% said can’t say.
| Response | Male (n=670) % | Female (n=833) % |
|---|---|---|
| Yes | 70 | 68 |
| No | 30 | 30 |
| Can’t say | 1 | 2 |
| Response | 18-24 (n=165) % | 25-34 (n=379) % | 35-49 (n=426) % | 50+ (n=533) % |
|---|---|---|---|---|
| Yes | 50 | 70 | 73 | 71 |
| No | 48 | 28 | 26 | 28 |
| Can’t say | 2 | 2 | 1 | 1 |
| Response | Metropolitan (n=915) % | Country (n=588) % |
|---|---|---|
| Yes | 71 | 66 |
| No | 28 | 33 |
| Can’t say | 1 | 1 |
Chart 2. Awareness of Federal Privacy Commissioner
Chart 2 illustrates the responses to the question Are you aware that a Federal Privacy Commissioner exists to uphold privacy laws and to investigate complaints people may have about the misuse of their personal information? The chart is broken down by gender, age and location. Out of a total 1503 respondents, 45% said yes, 53% said no and 2% said can’t say.
| Response | Male (n=670) % | Female (n=833) % |
|---|---|---|
| Yes | 47 | 42 |
| No | 51 | 55 |
| Can’t say | 1 | 3 |
| Response | 18-24 (n=165) % | 25-34 (n=379) % | 35-49 (n=426) % | 50+ (n=533) % |
|---|---|---|---|---|
| Yes | 34 | 37 | 45 | 51 |
| No | 63 | 62 | 53 | 47 |
| Can’t say | 3 | 3 | 1 | 2 |
| Response | Metropolitan (n=915) % | Country (n=588) % |
|---|---|---|
| Yes | 48 | 40 |
| No | 51 | 58 |
| Can’t say | 2 | 3 |
Chart 3. Reporting misuse of personal information
Chart 3 illustrates the responses to the question If you wanted to report the misuse of your personal information, who would you be most likely to contact? The responses (from all 1503 respondents) are as follows:
- Police: 30%
- Ombudsman: 19%
- The organisation that was involved: 13%
- The Privacy Commissioner (Federal or State): 10%
- State government department: 8%
- Local State MP: 7%
- Consumer Affairs (in your state): 4%
- Lawyers/solicitors: 4%
- Local Council: 2%
- Department of Fair Trading: 2%
- Seek advice from a friend or relative: 1%
- The media e.g. TV/Radio/newspapers: <1%
- Other: 3%
- Can’t say: 20%
Chart 4. Knowledge of which organisations are covered by the Privacy Act
Chart 3 illustrates the responses to the question I’m going to list six types of organisations. Which of these, if any, do you think GENERALLY must operate under the Federal Privacy Act? The responses (from all 1503 respondents) are as follows:
- Commonwealth Government departments: 94%
- State Government departments: 87%
- Large businesses: 72%
- Charities: 72%
- Small businesses: 59%
- Businesses based overseas: 35%
Chart 5. Activities respondents feel contravene the Privacy Act — By sex, age and location
Chart 5 illustrates the responses to the question Which of the following activities, if any, would be against the Federal Privacy Act? The chart is broken down by gender, age and location. Here are the questions and answers from all 1503 respondents:
- Your neighbours spying on you: 54%
- A bank or other organisation sends customer data to an overseas processing centre: 60%
- A small business reveals a customer’s information to other customers: 85%
- An individual steals your ID and uses it to pretend they are you: 88%
- A large business reveals a customer’s information to other customers: 88%
| Activity | Male (n=670) % | Female (n=833) % |
|---|---|---|
| Your neighbours spying on you | 51 | 58 |
| A bank or other organisation sends customer data to an overseas processing centre | 55 | 64 |
| A small business reveals a customer’s information to other customers | 82 | 87 |
| An individual steals your ID and uses it to pretend they are you | 86 | 90 |
| A large business reveals a customer’s information to other customers | 87 | 89 |
| Activity | 18-24 (n=165) % | 25-34 (n=379) % | 35-49 (n=426) % | 50+ (n=533) % |
|---|---|---|---|---|
| Your neighbours spying on you | 59 | 56 | 51 | 54 |
| A bank or other organisation sends customer data to an overseas processing centre | 53 | 57 | 56 | 65 |
| A small business reveals a customer’s information to other customers | 90 | 88 | 85 | 82 |
| An individual steals your ID and uses it to pretend they are you | 88 | 89 | 87 | 88 |
| A large business reveals a customer’s information to other customers | 93 | 89 | 88 | 87 |
| Activity | Metropolitan (n=915) % | Non-metropolitan (n=588) % |
|---|---|---|
| Your neighbours spying on you | 52 | 57 |
| A bank or other organisation sends customer data to an overseas processing centre | 56 | 65 |
| A small business reveals a customer’s information to other customers | 85 | 85 |
| An individual steals your ID and uses it to pretend they are you | 86 | 91 |
| A large business reveals a customer’s information to other customers | 88 | 88 |
Chart 6. Trust in organisations handling personal information
Chart 6 illustrates the responses to the question How trustworthy or untrustworthy would you say the following organisations are with regards to how they protect or use your personal information? The organisations are in order of being considered trustworthy, based on the responses of all 1503 respondents.
| Organisation | Trustworthy % | Neither Trustworthy Nor Untrustworthy % | Untrustworthy % | Can’t say % |
|---|---|---|---|---|
| Health Service Providers | 91 | 2 | 7 | 1 |
| Government Departments | 73 | 5 | 19 | 4 |
| Financial Institutions | 58 | 5 | 35 | 3 |
| Charities | 55 | 6 | 35 | 4 |
| Insurance companies | 47 | 5 | 43 | 3 |
| Retailers | 37 | 7 | 52 | 5 |
| Market Research Organisations | 35 | 6 | 53 | 6 |
| Real Estate Agents | 24 | 6 | 64 | 7 |
| Businesses selling over the Internet | 17 | 4 | 63 | 15 |
Chart 7. Frequency with which information is omitted from forms
Chart 7 illustrates the responses to the question When completing forms or applications that ask for personal details, such as your name, contact details, income, marital status etc, how often, if ever, would you say you leave some questions blank as a means of protecting your personal information? The chart compares responses from 2007, 2004 and 2001, based on all 1503 respondents.
| Response | 2007 % | 2004 % | 2001 % |
|---|---|---|---|
| Always | 10 | 9 | 7 |
| Often | 18 | 15 | 15 |
| Sometimes | 33 | 32 | 25 |
| Rarely | 20 | 18 | 23 |
| Never | 19 | 25 | 29 |
| Can’t say | 1 | 1 | 1 |
Chart 8. Decided NOT to deal with an organisation to protect personal information
Chart 8 illustrates the responses to two questions:
Firstly, have you ever decided not to deal with a private company or charity because of concerns over the protection or use of your personal information?
Have you ever decided not to deal with a government department because of concerns over the protection or use of your personal information?
The chart compares responses from 2007, 2004 and 2001, based on all 1503 respondents.
| Response | 2007 % | 2004 % | 2001 % |
|---|---|---|---|
| Decided not to deal with a private company or charity | 36 | 33 | 42 |
| Decided not to deal with a government department or agency | 12 | 16 | 14 |
Chart 9. Decided NOT to deal with an organisation by age
Chart 9 illustrates the responses to two questions:
Firstly, have you ever decided not to deal with a private company or charity because of concerns over the protection or use of your personal information?
Have you ever decided not to deal with a government department because of concerns over the protection or use of your personal information?
The chart is broken down by age groups, based on all 1503 respondents.
| Response | Total (n=1503) % | 18-24 years (n=165) % | 25-34 years (n=379) % | 35-49 years (n=426) % | 50+ years (n=533) % |
|---|---|---|---|---|---|
| Decided not to deal with a private company or charity | 36 | 25 | 42 | 43 | 32 |
| Decided not to deal with a government department or agency | 12 | 10 | 15 | 16 | 10 |
Chart 10. Reactions to unsolicited marketing material
Chart 10 illustrates the response to the question Which of the following statements best describes how you generally feel when organisations that you have never dealt with before send you unsolicited marketing information? The chart compares responses from 2007, 2004 and 2001, based on all 1503 respondents.
| Statement describing respondent’s feeling | 2007 % | 2004 % | 2001 % |
|---|---|---|---|
| I feel concerned about where they obtained my personal information | 53 | 48 | 55 |
| I feel angry and annoyed | 27 | 21 | 25 |
| It doesn’t bother me either way, I don’t care | 11 | 23 | 20 |
| It’s a bit annoying but it’s harmless | 23 | 15 | 17 |
| I enjoy reading the material and don’t mind getting it at all | 4 | 7 | 9 |
Chart 11. Likelihood of providing personal information for discount
Chart 11 illustrates the response to the question Generally, how likely or unlikely would you be to provide your personal information to an organisation if it meant you would receive discounted purchases? The chart compares responses from 2007, 2004 and 2001, based on all 1503 respondents.
| Response | 2007 % | 2004 % | 2001 % |
|---|---|---|---|
| Very likely | 3 | 7 | 6 |
| Quite likely | 19 | 21 | 26 |
| Neither | 3 | 5 | 11 |
| Quite unlikely | 33 | 27 | 29 |
| Very unlikely | 36 | 28 | 19 |
| Can’t say | 1 | 2 | 1 |
| Depends | 5 | 11 | 8 |
Chart 12. Proportion likely to provide personal information for discount or prize
Chart 12 illustrates the response to the two questions:
Generally, how likely or unlikely would you be to provide your personal information to an organisation if it meant you would receive discounted purchases?
And how about if it meant you would have a chance to win a prize?
The chart is broken down by age group, based on all 1503 respondents.
| Situation | Total (n=1503) % | 18-24 years (n=165) % | 25-34 years (n=379) % | 35-49 years (n=426) % | 50+ years (n=533) % |
|---|---|---|---|---|---|
| Discount | 22 | 39 | 30 | 20 | 15 |
| Chance to win a prize | 14 | 18 | 22 | 12 | 10 |
Chart 13. Use of the Electoral Roll and White Pages for marketing purposes
Chart 13 illustrates the response to the two questions:
I would like you now to think about your privacy and businesses. I’m going to read you a number of statements and I’d like you to tell me whether you agree or disagree with each:
- businesses should be able to use the electoral roll for marketing purposes
- businesses should be able to collect your information from the White Pages telephone directory without your knowledge for the purposes of marketing
The chart compares responses from 2007, 2004 and 2001, based on all 1503 respondents. It compares the responses regarding the White Pages to the Electoral Roll.
| Response | 2001 (n=1524) % | 2004 (n=1507) % | 2007 (n=1503) % |
|---|---|---|---|
| White Pages | |||
| Agree | 22 | 19 | 16 |
| Neither | 6 | 2 | 2 |
| Disagree | 70 | 77 | 82 |
| Can’t say | 2 | 2 | 1 |
| Electoral Roll | |||
| Agree | 42 | 44 | 46 |
| Neither | 11 | 8 | 3 |
| Disagree | 46 | 46 | 50 |
| Can’t say | 1 | 2 | 1 |
Chart 14. Scenarios regarded as misuses of personal information by businesses
Chart 14 illustrates the response to the question Which of the following instances would you regard to be a misuse of your personal information? Here are the scenarios and answers from all 1503 respondents:
- A business monitors your activities on the Internet, recording information on the sites you visit without your knowledge: 96%
- A business asks you for personal information that doesn’t seem to be relevant to the purpose of the transaction: 94%
- You supply your information to a business for a specific purpose and the business uses it for another purpose: 94%
- A business you don’t know gets hold of your personal information: 93%
Chart 15. Concern about business sending personal information overseas
Chart 15 illustrates the response to the question How concerned are you about Australian businesses sending their customers’ personal information overseas to be processed? The chart is broken down by gender, age and household income, and shows the responses of all 1503 respondents. In total, 63% were very concerned, 27% were somewhat concerned, 9% were not concerned and 1% said can’t say.
| Level of concern | Male (n=670) % | Female (n=833) % |
|---|---|---|
| Very concerned | 59 | 67 |
| Somewhat concerned | 30 | 25 |
| Not concerned | 10 | 7 |
| Can’t say | 1 | 1 |
| Level of concern | 18-24 (n=165) % | 25-34 (n=379) % | 35-49 (n=426) % | 50+ (n=533) % |
|---|---|---|---|---|
| Very concerned | 30 | 53 | 70 | 73 |
| Somewhat concerned | 46 | 37 | 23 | 20 |
| Not concerned | 23 | 10 | 6 | 6 |
| Can’t say | 1 | 1 | 1 | 1 |
| Level of concern | <$75,000 (n=766) % | $75 - $100,000 (n=188) % | $100,000+ (n=267) % |
|---|---|---|---|
| Very concerned | 66 | 56 | 54 |
| Somewhat concerned | 26 | 32 | 32 |
| Not concerned | 8 | 12 | 13 |
| Can’t say | 1 | 0 | 1 |
Chart 16. Attitudes towards a unique identifier for all Australian Government departments
Chart 16 illustrates the response to the question If it was suggested that you be given a unique number to be used for identification by all Commonwealth Government departments and to use all Government services, would you be in favour of this? The chart is broken down by gender and household income, and shows the responses of all 1503 respondents. In total, 62% agreed and 31% disagreed.
| Response | Male (n=670) % | Female (n=833) % |
|---|---|---|
| Agree | 63 | 61 |
| Disagree | 30 | 32 |
| Response | <$75,000 (n=766) % | $75-$100,000 (n=188) % | $100,000+ (n=267) % |
|---|---|---|---|
| Agree | 62 | 70 | 64 |
| Disagree | 31 | 26 | 28 |
Chart 17. Circumstances under which Government departments should be able to share information
Chart 17 illustrates the response to the question Do you believe Government departments should be able to cross-reference or share information in their databases about you and other Australians for any purpose, some purposes or not at all? The chart compares responses from 2007 and 2004, based on all 1503 respondents.
| Response | 2007 (n=1503) % | 2004 (n=1507) % |
|---|---|---|
| Any purpose | 15 | 9 |
| Some purposes | 65 | 62 |
| Not at all | 19 | 24 |
| Can’t say | 1 | 5 |
Chart 18. Purposes for which Government departments should be able to share information
Chart 18 illustrates the response to the question For which of the following purposes do you believe Governments should be allowed to cross reference your personal information? The chart shows the responses from the 1210 respondents who believed Government should be able to share information. 77% said to prevent or solve fraud or other crime, 67% said updating information like contact details and 49% said to reduce costs or improve efficiency.
Chart 19. Scenarios regarded to be misuses of personal information
Chart 19 illustrates the response to the question Which of the following instances would you regard to be a misuse of your personal information? The chart shows the responses from all 1503 respondents. There were 4 scenarios; the scenarios and responses are as follows:
- A government department asks you for personal information that doesn’t seem to be relevant to the purpose of the transaction: 87%
- You supply your information to a government department for a specific purpose and the agency uses it for another purpose: 86%
- A government department monitors your activities on the Internet, recording information on the sites you visit without your knowledge: 86%
- A government department you haven’t dealt with gets hold of your personal information: 73%
Chart 20. Inclusion of medical information in a National Health Information Network
Chart 20 illustrates the response to the question If such a database existed, do you think inclusion of your medical information should be VOLUNTARY, or should ALL MEDICAL RECORDS be entered without permission or consent? The chart shows the responses from all 1503 respondents. 76% said inclusion should be voluntary, 21% said all medical records should be entered, 1% said other and 2% said can’t say.
Chart 21. Permission sought before de-identified health information released
Chart 21 illustrates the response to the question Health information is often sought for research purposes and is generally de-identified, that is, NOT linked with information that identifies an individual. Do you believe that an individual’s permission should be sought before their de-identified health information is released for research purposes or not? The chart is broken down by gender and age. Out of a total 1503 respondents, 51% said yes, 46% said no, 2% said maybe and 1% said can’t say.
| Response | Male (n=184) % | Female (n=184) % |
|---|---|---|
| Yes | 48 | 53 |
| No | 49 | 43 |
| Maybe | 2 | 2 |
| Can’t say | 1 | 1 |
| Response | 18-24 years (n=184) % | 25-34 years (n=289) % | 35-49 years (n=445) % | 50+ years (n=589) % |
|---|---|---|---|---|
| Yes | 49 | 51 | 51 | 51 |
| No | 47 | 46 | 47 | 45 |
| Maybe | 4 | 2 | 2 | 2 |
| Can’t say | 1 | 1 | 1 | 1 |
Chart 22. Attitudes towards health professionals sharing information
Chart 22 illustrates the response to the question When do you think your doctor should be able to share your health information with other doctors or health service providers? The chart shows the responses from the 1378 respondents who gave a single answer. The responses were as follows:
- Only for purposes that are related to the specific condition being treated: 32%
- For no purpose, they should always ask for my consent: 30%
- For anything to do with my health: 26%
- Only for serious or life threatening conditions: 12%
- Don’t know/Can’t say: 1%
Chart 23. Attitudes to doctors discussing patient details with other medical practitioners
Chart 23 illustrates the response to the question Do you agree or disagree that your doctor should be able to discuss your personal medical details with other health professionals – in a way that identifies you – without your consent if they believe this would assist your treatment? The chart is broken down by gender and education. Out of a total 1503 respondents, 33% strongly agreed, 27% partly agreed, 1% said neither, 15% partly disagreed and 24% strongly disagreed.
| Response | Male (n=670) % | Female (n=833) % |
|---|---|---|
| Strongly agree | 37 | 29 |
| Partly agree | 27 | 26 |
| Neither | 0 | 1 |
| Partly disagree | 15 | 15 |
| Strongly disagree | 20 | 28 |
| Response | Up to Year 12 (n=577) % | Diploma/trade (n=376) % | Degree (n=541) % |
|---|---|---|---|
| Strongly agree | 34 | 35 | 29 |
| Partly agree | 28 | 26 | 25 |
| Neither | 0 | 1 | 0 |
| Partly disagree | 14 | 15 | 17 |
| Strongly disagree | 25 | 23 | 27 |
Chart 24. Attitudes to the disclosure of the fact that a patient has a genetic illness — with and without consent
Chart 24 illustrates the response to the question If a person has a serious genetic illness, under what circumstances do you think it is appropriate for their doctor to tell a relative so the relative could be tested for the same illness? The chart is broken down by gender, age and highest education level reached. Out of a total 1503 respondents, 19% said Without the patient’s consent, relative is unlikely to have the condition, 36% said Without the patient’s consent, there is a strong possibility that the relative also has the condition, 43% said Only if the patient consents to their relative being told and 3% said Can’t say.
| Response | Male (n=670) % | Female (n=833) % |
|---|---|---|
| Without the patient’s consent, relative is unlikely to have the condition | 19 | 18 |
| Without the patient’s consent, there is a strong possibility that the relative also has the condition | 38 | 33 |
| Only if the patient consents to their relative being told | 40 | 45 |
| Can’t say | 3 | 3 |
| Response | 18-24 (n=165) % | 25-34 (n=379) % | 35-49 (n=426) % | 50+ (n=533) % |
|---|---|---|---|---|
| Without the patient’s consent, relative is unlikely to have the condition | 13 | 17 | 19 | 21 |
| Without the patient’s consent, there is a strong possibility that the relative also has the condition | 44 | 35 | 37 | 33 |
| Only if the patient consents to their relative being told | 41 | 44 | 41 | 44 |
| Can’t say | 2 | 4 | 3 | 2 |
| Response | Up to year 12 (n=577) % | Diploma/trade (n=376) % | Degree (n=541) % |
|---|---|---|---|
| Without the patient’s consent, relative is unlikely to have the condition | 18 | 21 | 19 |
| Without the patient’s consent, there is a strong possibility that the relative also has the condition | 35 | 41 | 33 |
| Only if the patient consents to their relative being told | 45 | 35 | 45 |
| Can’t say | 2 | 2 | 3 |
Chart 25. Attitudes towards employees having access to information their employer keeps about them
Chart 25 illustrates the response to the question Do you think employees should have access to the information their employer holds about them? The chart is broken down by socio-economic standing. Out of a total 1503 respondents, 86% said yes, 12% said no and 2% said can’t say.
| Response | Upper white collar (n=566) % | Lower white collar (n=604) % | Upper blue collar (n=115) % | Lower blue collar (n=117) % |
|---|---|---|---|---|
| Yes | 89 | 85 | 85 | 78 |
| No | 9 | 12 | 15 | 20 |
| Can’t say | 1 | 3 | 0 | 2 |
Chart 26. Attitudes to employers reading emails, drug and alcohol testing and monitoring vehicle locations
Chart 26 illustrates the response to the question I’m going to read you three statements. For each could you tell me if you think it’s appropriate behaviour for an employer to do whenever they choose, only if they suspect wrong-doing or not at all.
| Response | Reading emails | Drug and alcohol testing | Monitoring vehicle location |
|---|---|---|---|
| Whenever they choose | 25 | 33 | 30 |
| Only if they suspect wrongdoing | 43 | 44 | 43 |
| Not at all | 30 | 20 | 25 |
| Don’t know | 2 | 3 | 2 |
Chart 27. Attitudes towards employers using surveillance equipment and monitoring everything employees type into their computer
Chart 27 illustrates the response to the question I’m going to read you three statements. For each could you tell me if you think it’s appropriate behaviour for an employer to do whenever they choose, only if they suspect wrong-doing, for the safety and security of all employees, or not at all? (Note, these statements were read to respondents at the same time as ‘monitoring employees’ telephone conversations’)
| Response | Surveillance (n=1410) % | Monitoring of computer (n=1423) % |
|---|---|---|
| Whenever they choose | 16 | 21 |
| Only if they suspect wrongdoing | 17 | 32 |
| For the safety and security of employees | 44 | 18 |
| Not at all | 22 | 28 |
| Don’t know | 1 | 1 |
Chart 28. Attitudes towards employers monitoring employees’ telephone conversations
Chart 28 illustrates the response to the question I’m going to read you three statements. For each could you tell me if you think it’s appropriate behaviour for an employer to do whenever they choose, only if they suspect wrong-doing, for the safety and security of all employees, or not at all ? (Note, this statement was read to respondents at the same time as ‘surveillance’ and ‘monitoring of computer’). Out of a base of respondents who gave a single answer (1355 in total), the responses were as follows:
- Whenever they choose: 7%
- Only if they suspect wrongdoing: 25%
- For training and quality control purposes: 38%
- Not at all: 29%
- Don’t know: 1%
Chart 29. Importance of employer privacy policies
Chart 29 illustrates the response to the question How important is it to you that an employer has a privacy policy that covers when they will read employee emails, randomly drug test employees, use surveillance equipment to monitor employees and monitor telephone conversations. The chart is broken down by socio-economic standing and highest education. Out of a total 1503 respondents, 86% thought they were important.
Responses by socio-economic standing:
- Upper white collar (n=566): 90%
- Lower white collar (n=604): 86%
- Upper blue collar (n=115): 84%
- Lower blue collar (n=117): 80%
Responses by highest education:
- Up to year 12 (n=577): 83%
- Diploma/trade (n=376): 86%
- Degree (n=541): 91%
Chart 30. Levels of concern about personal information on the Internet compared with two years ago
Chart 30 illustrates the response to the question Are you MORE OR LESS concerned about the privacy of your personal information while using the Internet than you were two years ago? The chart is broken down by gender, age and highest education. Out of a total 1503 respondents, 50% were more concerned, 31% were as concerned, 11% were less concerned, and 8% said can’t say.
| Level of concern | Male (n=670) % | Female (n=833) % |
|---|---|---|
| More concerned | 46 | 54 |
| As concerned | 33 | 28 |
| Less concerned | 13 | 9 |
| Can’t say | 8 | 9 |
| Level of concern | 18-24 (n=165) % | 25-34 (n=379) % | 35-49 (n=426) % | 50+ (n=533) % |
|---|---|---|---|---|
| More concerned | 45 | 46 | 55 | 51 |
| As concerned | 33 | 35 | 32 | 27 |
| Less concerned | 20 | 17 | 9 | 6 |
| Can’t say | 1 | 2 | 3 | 16 |
| Level of concern | <$75,000 (n=766) % | $75-$100,000 (n=188) % | $100,000+ (n=267) % |
|---|---|---|---|
| More concerned | 51 | 49 | 48 |
| As concerned | 28 | 35 | 35 |
| Less concerned | 9 | 14 | 16 |
| Can’t say | 12 | 3 | 1 |
Chart 31. Concern about providing personal information over the Internet versus in hard copy
Chart 31 illustrates the response to the question Are you more or less concerned about providing your personal details electronically or online compared to in a hard copy/paper based format? The chart is broken down by age and household income. Out of a total 1503 respondents, 65% were more concerned and 6% were less concerned.
| Response | 18-24 (n=165) % | 25-34 (n=379) % | 35-49 (n=426) % | 50+ (n=533) % |
|---|---|---|---|---|
| More concerned | 71 | 67 | 66 | 62 |
| Less concerned | 4 | 10 | 6 | 4 |
| Response | <$75,000 (n=766) % | $75 - $100,000 (n=186) % | $100,000+ (n=267) % |
|---|---|---|---|
| More concerned | 65 | 71 | 61 |
| Less concerned | 6 | 5 | 8 |
Chart 32. Concern about providing personal information over the Internet versus over the telephone
Chart 32 illustrates the response to the question And are you more or less concerned about providing your personal details electronically or online as opposed to over the telephone? The chart is broken down by age and household income. Out of a total 1503 respondents, 45% were more concerned and 12% were less concerned.
| Response | 18-24 (n=165) % | 25-34 (n=379) % | 35-49 (n=426) % | 50+ (n=533) % |
|---|---|---|---|---|
| More concerned | 41 | 46 | 47 | 44 |
| Less concerned | 18 | 17 | 11 | 8 |
| Response | <$75,000 (n=766) % | $75 - $100,000 (n=186) % | $100,000+ (n=267) % |
|---|---|---|---|
| More concerned | 46 | 45 | 43 |
| Less concerned | 10 | 18 | 14 |
Chart 33. Providing false information in online forms
Chart 33 illustrates the response to the question When completing online forms or applications that ask for personal details, have you ever PROVIDED FALSE INFORMATION as a means of protecting your privacy? The chart is broken down by gender, age and location. Out of a total 1503 respondents, 25% said yes, 67% said no and 8% said can’t say.
| Response | Male (n=670) % | Female (n=833) % |
|---|---|---|
| Yes | 30 | 21 |
| No | 63 | 70 |
| Can’t say | 7 | 8 |
| Response | 18-24 (n=165) % | 25-34 (n=379) % | 35-49 (n=426) % | 50+ (n=533) % |
|---|---|---|---|---|
| Yes | 58 | 40 | 27 | 8 |
| No | 40 | 58 | 69 | 77 |
| Can’t say | 1 | 2 | 5 | 15 |
| Response | Metropolitan (n=915) % | Non-metropolitan (n=588) % |
|---|---|---|
| Yes | 30 | 18 |
| No | 64 | 71 |
| Can’t say | 6 | 11 |
Chart 34. Incidence of being the victim or personally knowing a victim of ID fraud/theft
Chart 34 illustrates the response to the question Have you or someone you personally know ever been the victim of identity fraud or theft? The chart is broken down by age and household income. Out of a total 1503 respondents, 9% had been a victim and 17% knew a victim.
|
18-24 (n=165) % |
25-34 (n=379) % |
35-49 (n=426) % |
50+ (n=533) % | |
| Been a victim | 2 | 8 | 12 | 9 |
| Know a victim | 19 | 22 | 15 | 14 |
|
<$25,000 (n=235) % |
$25,000-$75,000 (n=531) % |
$75,000- $100,000 (n=188) % |
>$100,000 (n=267) % | |
| Been a victim | 7 | 9 | 10 | 11 |
| Know a victim | 9 | 17 | 19 | 21 |
Chart 35. Incidence of being the victim or personally knowing a victim of ID fraud/theft
Chart 35 illustrates the response to the question Do you think it is acceptable that you need to show / copy identification documents (such as a drivers license or passport) in the following situations: (followed by 5 situations). There were 1503 respondents.
| Copy % | Show % | |
|---|---|---|
| To obtain credit card | 96 | 57 |
| To purchase goods (over 18) | 93 | 23 |
| On entry to licenced premises | 80 | 18 |
| To get access to services | 60 | 23 |
| To purchase general goods | 7 | 4 |
Chart 36. Awareness of CCTV
Chart 36 illustrates the response to the question Are you aware of or have you seen CCTV cameras? (followed by 5 situations). The chart is broken down by gender, age and socio-economic standing. Out of a total 1503 respondents, 92% answered in the affirmative.
Responses by gender:
- Male (n=670): 96%
- Female (n=833): 89%
Responses by age:
- 18-24 (n=165): 88%
- 25-34 (n=379): 93%
- 35-49 (n=426): 94%
- 50+ (n=533): 93%
Responses by socio-economic standing:
- Upper white collar (n=566): 96%
- Lower white collar (n=604): 90%
- Upper blue collar (n=115): 94%
- Lower blue collar (n=117): 90%
Chart 37. Organisations that should have access to CCTV footage
Chart 37 illustrates the response to the question Which organisation or organisations, if any, do you think should have access to what has been recorded on CCTV cameras? There were 1387 respondents, that is, the respondents who were aware of CCTV. The responses were as follows:
- Police: 88%
- Security companies: 20%
- Government: 15%
- Anti-terrorist agencies: 12%
- Organisation that installed it: 11%
- Local councils: 8%
- Businesses: 7%
Note responses of less than 5% have been omitted – these included the courts and emergency services (3% each), law enforcement/crime prevention services (2% each) and 2% other responses. 2% were unable to answer, but no-one responded ‘none’.
Chart 38. Places where it is appropriate for CCTV cameras to be installed
Chart 38 illustrates the response to the question Where it is appropriate to have CCTV cameras? There were 1387 respondents, that is, the respondents who were aware of CCTV. The responses were as follows:
- Public places where people congregate: 34%
- Private institutions: 29%
- Shopping centres / malls: 28%
- Where public is at risk: 24%
- Public transport/stops and stations: 23%
- City streets: 20%
- Car parks: 12%
- Everywhere except homes/bathrooms: 9%
- Public institutions: 8%
- Other: 7%
- Don’t know: 2%
Footnotes
[1] Roy Morgan Research
[2] As the corresponding questions were asked in a significantly different manner in 2004 it would not be appropriate to make a comparison in this report.
[3] Mail order companies were excluded from the 2007 survey.
[4] Internet Activity Survey. March 2007. ABS Catalogue number 8153.0
[5] eg ‘When bad things happen to your good name’ - Australasian Centre for Policing Research; ‘id Theft – A kit to prevent and respond to identity theft’ The National Crime Prevention Program (in association with others) – Towards a Safer Australia.
[6] This is the average number of responses each respondent gave to the question.


