-
On this page
Australians remain cautious about the use of AI, particularly where it involves personal information or impacts important decisions. There is a strong expectation that clear safeguards, transparency and human oversight should be in place, and growing demand for accountability in how AI systems operate. Acceptance of AI varies by use case, with greater comfort for lower-risk applications and clear resistance to high-stakes or automated decision-making. Australians are also generally opposed to the reuse of personal information for AI training beyond its original purpose, and expect higher standards of responsibility from trusted sectors such as government, health and financial institutions.
Similarly, Australians are increasingly cautious about biometric technologies, with discomfort outweighing comfort across most uses, especially for more advanced or predictive applications such as analysing behaviour or emotions. Acceptance depends heavily on context, with greater comfort in situations that offer clear personal or public benefit, such as identity verification, government services, and personal device use, and much lower comfort in commercial or marketing contexts. Public safety and harm prevention uses are viewed more favourably, particularly among older Australians, while trust is notably higher in government and law enforcement agencies and low in businesses, reinforcing concerns about commercial use of biometric data.
8.1. Artificial Intelligence
Conditions required for acceptable AI use
Australians remain cautious about the use of artificial intelligence (AI) in decision-making that may affect them, with nearly all (96%) saying some conditions should be in place before it is used, consistent with 2023 (96%).
Transparency
Australians expect organisations to be open about how AI is used and how decisions are made, including:
- being informed when AI is being used (79%, up from 71% in 2023)
- being informed if personal information will be shared with a third-party AI provider (74%)
- clear explanations of how AI decisions are made (63%, up from 59%).
Human oversight, accountability and contestability
Australians expect AI systems to be validated and monitored, and they want people to be able to question and challenge AI-driven decisions, including:
- the right to have a human review decisions (81%, up from 73% in 2023)
- validation of AI accuracy (70%, up from 56%)
- testing for bias and discrimination (68%, up from 57%)
- the ability to challenge decisions made by AI (72%, up from 64%).
Privacy and data protection
Australians expect stronger protections for personal information used by AI, including:
- limits that personal information is not retained by third-party AI providers beyond what is necessary (80%)
- strict privacy rules for organisations and third-party AI providers (76%, up from 69%)
- personal information not used to train external AI systems without consent (76%)
- the right to request information about how AI decisions are made (70%).
Support for additional conditions is more pronounced among Australians aged 55 and over, those who speak only English at home, and those generally in the middle when it comes to adopting new technologies.
Figure 33 Essential conditions for organisations using AI to make decisions
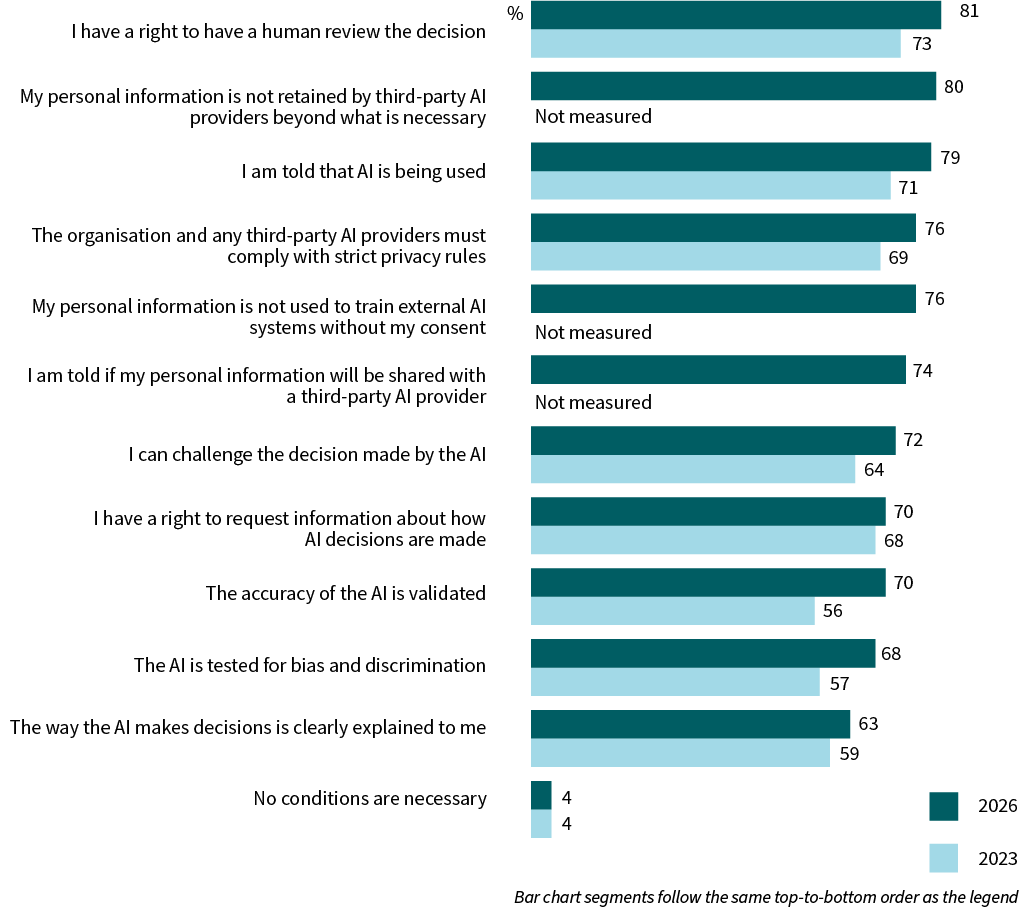
F11. What conditions do you consider to be essential before an organisation uses artificial intelligence (AI) to make a decision that might affect you?
Base: All Australians aged 18+. (2026: n=1,504, 2023: n=1,642)
Notes: Don’t know (1%) and refused (<0.5%) not displayed.
Acceptability of AI uses involving personal information
Acceptance of AI uses involving personal information varies considerably by application, with higher support for lower-risk or protective uses and greater resistance to high-stakes decision-making.
AI use for fraud detection is more widely accepted (64%), though views are more mixed for facial recognition or biometric identification (37%) and customer service chatbots (37%). Acceptance is lowest for automated eligibility or risk-based decisions, such as loan approvals or benefit eligibility, with only one-quarter (25%) viewing this as acceptable.
Acceptance of AI uses is clearly uneven across the population and reflect differing assessments of risk, familiarity and appropriateness across applications and groups:
- Younger Australians aged 18–24 are more than twice as likely as those aged 25+ to consider the use of AI for fraud detection somewhat or very unacceptable (32% vs 14%).
- Older Australians aged 50+ (49% vs 27% of those aged 18–49) and those who are typically slower to adopt new technologies (46% vs 33% of those who are earlier or mid adopters) are more likely to feel uncomfortable with customer service chatbots.
Figure 34 Acceptability of using AI with personal information for different purposes
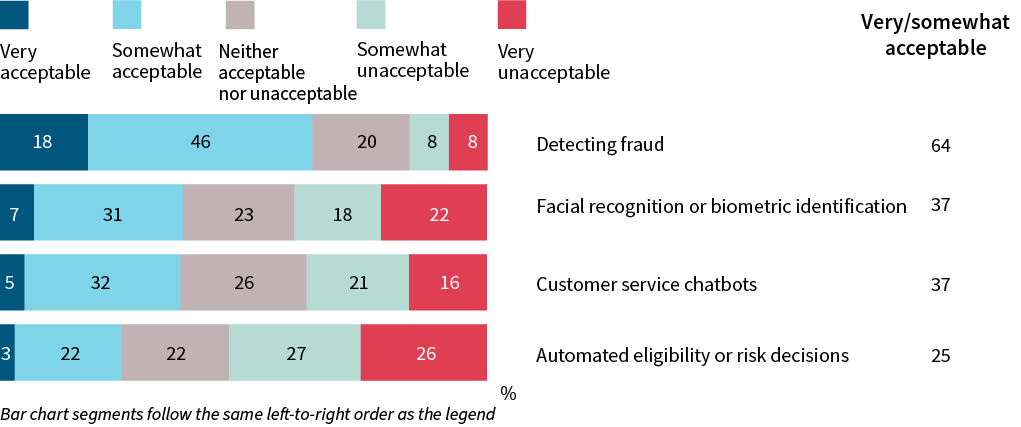
Base: All Australians aged 18+. (n=1,504)
Notes: Don’t know (all <1%) and refused (all <0.5%) not displayed.
Use of personal information to train AI systems
Around 7 in 10 Australians (71%) consider it somewhat or very unacceptable for organisations to use personal information originally provided for a service to train AI systems after that service has been completed, with 45% considering it very unacceptable. This aligns with broader views on fairness, with 93% of Australians considering the use of personal information to train AI models and products unfair and unreasonable.
Those who consider it unacceptable for organisations to use personal information to train AI systems after a service has been completed are more likely to be:
- older Australians aged 65+ (81% vs 68% of those aged 18–64)
- English-only speakers (75% vs 59% of those who speak a language other than English at home).
Expectations of responsible AI use by sector
Trust and perceived obligations around AI governance vary clearly by sector, organisational role and context, with higher expectations placed on public and essential service organisations.
Australians are most likely to expect responsible AI use from:
- government agencies (72%)
- health services (69%)
- banks and financial institutions (68%).
In contrast, expectations are notably lower for sectors with more commercial or platform‑based models, including:
- social media platforms (39%)
- not‑for‑profit organisations (38%)
- online retailers (35%).
Women are more likely than men to expect responsible AI use from government agencies (75% vs 69%), health services (74% vs 64%), insurance companies (56% vs 49%), and telecommunications companies (54% vs 45%). Older Australians aged 50+ are also more likely than those aged 18–49 to expect responsible AI use across most sectors, with the exception of social media platforms, where expectations do not differ by age.
Figure 35 Expected responsible use of AI by organisation type
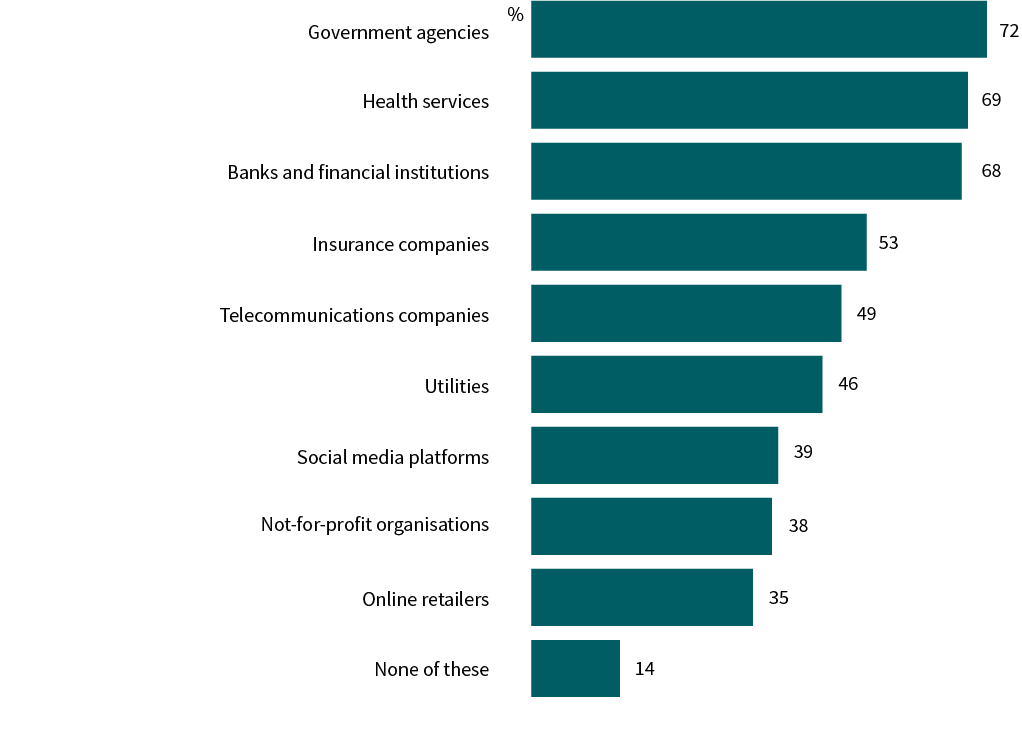
F16. From which types of organisations do you expect more responsible use of AI with your personal information?
Base: All Australians aged 18+. (n=1,504)
Notes: Don’t know (0%) and refused (0%) not displayed.
8.2. Biometric technology
Biometric analysis uses a wide variety of techniques, such as artificial intelligence, to make assumptions or predictions about the characteristics of an individual from their biometric data.
Comfort with biometric analysis
Comfort with the use of biometric analysis remains generally low, with Australians more likely to report discomfort than comfort across most applications. Comparisons over time suggest that unease may be increasing, with higher levels of discomfort reported across several use cases over the past 3 years since the previous iteration in 2023.
Views are most evenly divided when biometric analysis is used to determine health or disease status, with similar proportions feeling comfortable (38%) and uncomfortable (39%), although comfort has declined since 2023 (45%).
For all other applications, discomfort clearly outweighs comfort. Compared with 2023, a larger share of Australians report feeling uncomfortable with the use of biometrics for more interpretive or inferential purposes:
- estimate attributes such as age, sex, gender or ethnicity (51% vs 38%)
- identify behaviours or predict actions (55% vs 44%)
- assess emotions (58% vs 51%).
Attitudes towards biometric analysis also vary by familiarity with emerging technologies and technology adoption. Those who identify as earlier adopters of new technology are more likely than those slower to adopt to feel comfortable with biometric analysis to estimate attributes such as age, sex, gender or ethnicity (36% vs 22%) and to determine a person’s health or disease status (50% vs 35%).
Figure 36 Comfort with the use of biometric analysis for different purposes
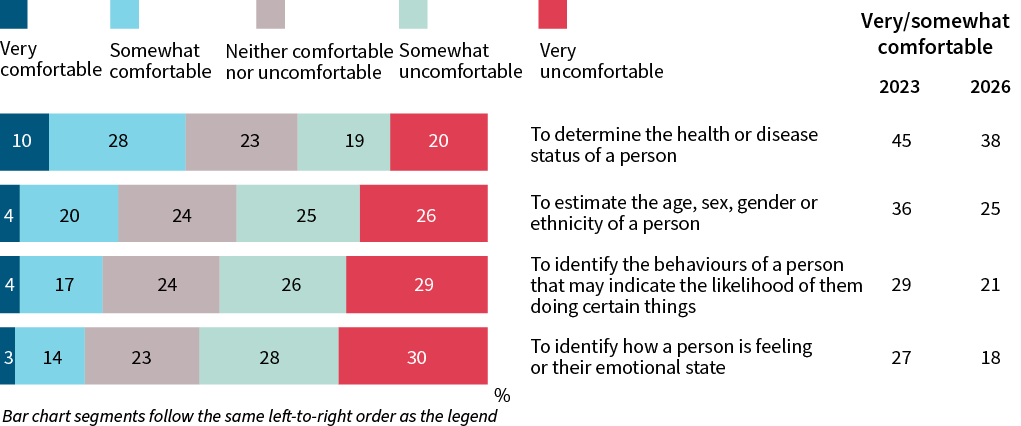
B1. How comfortable are you with the use of biometric analysis for the following?
Base: All Australians aged 18+. (2026: n=1,504, 2023: n=1,653)
Notes: Don’t know (0%) and refused (0%) not displayed.
Comfort with one-to-one uses of biometric information
Comfort with the use of biometric information, where a person’s biometric data is matched against their own stored record to verify their identity, varies by context, with higher comfort in security-sensitive or personal-use scenarios and lower comfort in commercial or discretionary settings.
Australians are more likely to feel comfortable using biometric information for:
- passport control at airports (65%)
- personal devices such as unlocking a phone or collecting fitness data (61%, continuing an upward trend from 39% in 2020 and 55% in 2023)
- accessing government services (56%)
- everyday banking (55%)
- domestic flights (50%, down from 55% in 2023).
Comfort is comparatively lower in more optional or commercial contexts, reflecting greater sensitivity to the perceived necessity of biometric use in those scenarios:
- work or study settings (39%, down from 45% in 2023)
- verifying age online (33%)
- accessing business services (27%, down from 36%)
- entering entertainment venues (26%, down from 33%).
Younger Australians aged 18–34 are more likely than those aged 35+ to feel uncomfortable using biometric information to verify their age online (54% vs 37%), suggesting age-based differences in how this specific use case is received.
Comfort with one-to-many uses of biometric information
Comfort with one-to-many uses of biometric information, where a person’s biometric data (such as facial recognition) is compared against many records in a database to identify who they are, varies strongly by context, with higher reported comfort in public safety and regulated harm-prevention settings and lower comfort in commercial applications.
Australians are more likely to feel comfortable with biometric information being used for:
- public safety by state and federal police (57%)
- identifying self-excluded individuals in gambling venues (50%)
- excluding patrons from licensed venues based on past behaviour (47%).
Support for these uses is stronger among older Australians, particularly those aged 50+ for police use (66% vs 50% of Australians aged 18–49), and those aged 65 and over for gambling venues (61% vs 47% of Australians aged 18–64) and licensed venues (57% vs 34%).
By contrast, views are more mixed when biometrics information is used by retail stores to exclude customers due to past behaviours (39% comfortable vs 35% uncomfortable).
Comfort is lowest for personalisation and advertising uses, with only one in 10 Australians comfortable with:
- retail stores recognising customers to recommend products (11%, down from 19%)
- shopping centres targeting advertisements (9%, down from 17% in 2023).
Women are more likely than men to feel uncomfortable with these uses, including retail personalisation to recommend products using biometric information (73% vs 66%) and exclusion based on past behaviour (38% vs 31%), suggesting gender-based differences in how these applications are received.
Figure 37 Comfort with one-to-many uses of biometric information
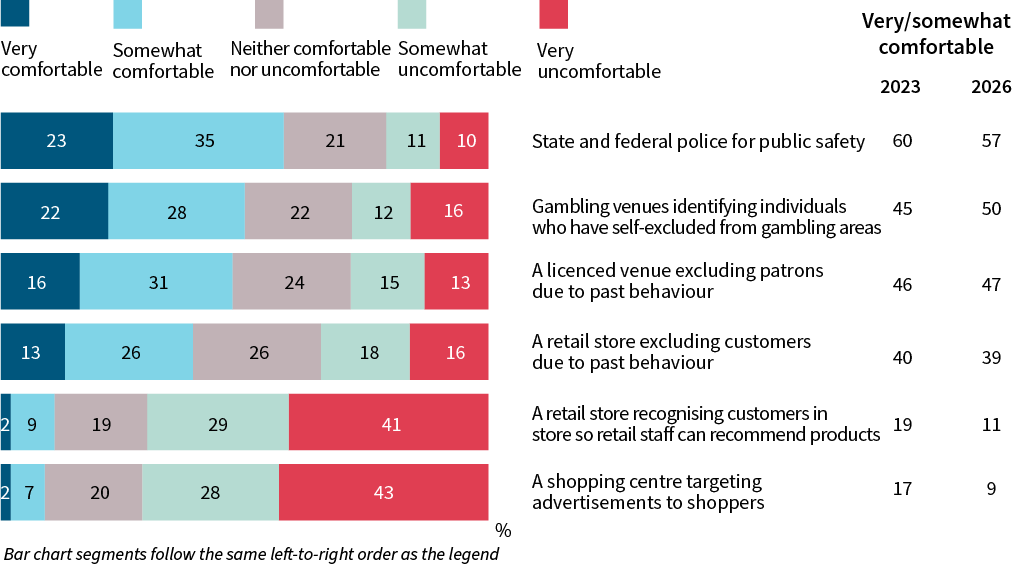
B3. How comfortable are you with the use of your biometric information in the following situations?
Base: All Australians aged 18+. (2026: n=1,504, 2023: n=1,653)
Notes: Don’t know (0%) and refused (0%) not displayed.
Trust in organisations’ handling of biometric data
Trust in organisations to collect and use biometric information varies significantly by sector, with higher trust in government-related bodies and lower trust in businesses.
Australians are more likely to consider the following organisations trustworthy, all broadly consistent with 2023 levels:
- border security (70%)
- state and federal police (66%)
- government agencies (60%).
Older Australians aged 65+ are more likely than those aged 18–64 to rate these institutions as very trustworthy, including border security (35% vs 24%), police (33% vs 19%), and government agencies (25% vs 13%).
In contrast, trust in businesses is much lower, with one in 8 (13%) considering them trustworthy, a further decline from 24% in 2023. Men are more likely than women to view businesses as untrustworthy (56% vs 49%).
Figure 38 Trust in organisations’ handling of biometric information
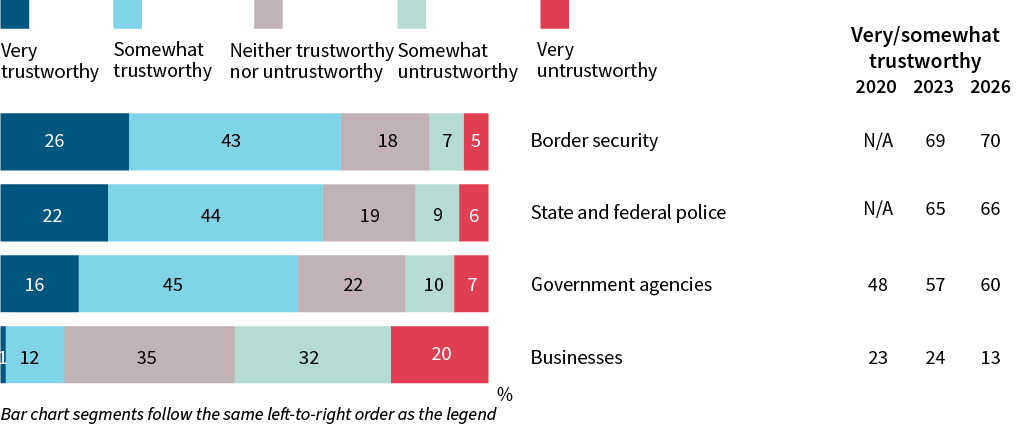
B4. In your opinion, how trustworthy are the following to collect and use biometric information?
Base: All Australians aged 18+. (2026: n=1,504, 2023: n=1,653)
Notes: Don’t know (0%) and refused (0%) not displayed.


